Conduct an appropriate test to determine whether variable gender is statistically significant at 5%. Should this variable be dropped from this regression model. e)
Conduct an appropriate test to determine whether variable gender is statistically significant at 5%. Should this variable be dropped from this regression model. e)

College Algebra
7th Edition
ISBN:9781305115545
Author:James Stewart, Lothar Redlin, Saleem Watson
Publisher:James Stewart, Lothar Redlin, Saleem Watson
Chapter1: Equations And Graphs
Section: Chapter Questions
Problem 10T: Olympic Pole Vault The graph in Figure 7 indicates that in recent years the winning Olympic men’s...

Related questions
Question
i need Part E solution
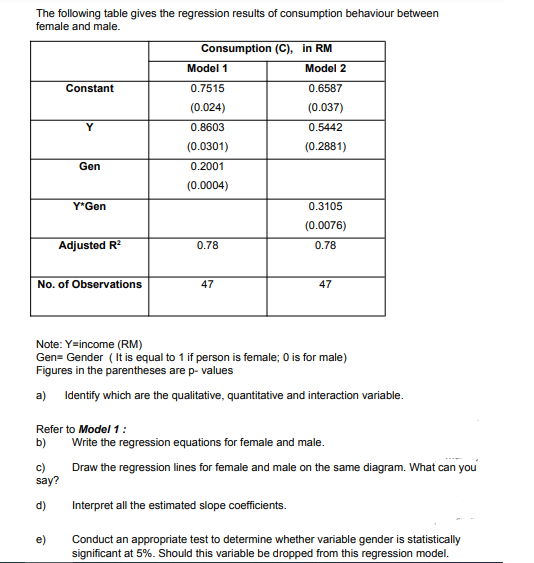
Transcribed Image Text:The following table gives the regression results of consumption behaviour between
female and male.
Consumption (C), in RM
Model 1
Model 2
Constant
0.7515
0.6587
(0.024)
(0.037)
Y
0.8603
0.5442
(0.0301)
(0.2881)
Gen
0.2001
(0.0004)
Y*Gen
0.3105
(0.0076)
Adjusted R
0.78
0.78
No. of Observations
47
47
Note: Y=income (RM)
Gen= Gender ( It is equal to 1 if person is female; 0 is for male)
Figures in the parentheses are p- values
a) Identify which are the qualitative, quantitative and interaction variable.
Refer to Model 1:
b)
Write the regression equations for female and male.
Draw the regression lines for female and male on the same diagram. What can you
c)
say?
d)
Interpret all the estimated slope coefficients.
e)
Conduct an appropriate test to determine whether variable gender is statistically
significant at 5%. Should this variable be dropped from this regression model.
Expert Solution
This question has been solved!
Explore an expertly crafted, step-by-step solution for a thorough understanding of key concepts.

Step by step
Solved in 2 steps with 2 images

Knowledge Booster


Learn more about
Need a deep-dive on the concept behind this application? Look no further. Learn more about this topic, statistics and related others by exploring similar questions and additional content below.Recommended textbooks for you
College Algebra
Algebra
ISBN:
9781305115545
Author:
James Stewart, Lothar Redlin, Saleem Watson
Publisher:
Cengage Learning

Linear Algebra: A Modern Introduction
Algebra
ISBN:
9781285463247
Author:
David Poole
Publisher:
Cengage Learning

Glencoe Algebra 1, Student Edition, 9780079039897…
Algebra
ISBN:
9780079039897
Author:
Carter
Publisher:
McGraw Hill
College Algebra
Algebra
ISBN:
9781305115545
Author:
James Stewart, Lothar Redlin, Saleem Watson
Publisher:
Cengage Learning
Linear Algebra: A Modern Introduction
Algebra
ISBN:
9781285463247
Author:
David Poole
Publisher:
Cengage Learning
Glencoe Algebra 1, Student Edition, 9780079039897…
Algebra
ISBN:
9780079039897
Author:
Carter
Publisher:
McGraw Hill

Functions and Change: A Modeling Approach to Coll…
Algebra
ISBN:
9781337111348
Author:
Bruce Crauder, Benny Evans, Alan Noell
Publisher:
Cengage Learning

Big Ideas Math A Bridge To Success Algebra 1: Stu…
Algebra
ISBN:
9781680331141
Author:
HOUGHTON MIFFLIN HARCOURT
Publisher:
Houghton Mifflin Harcourt