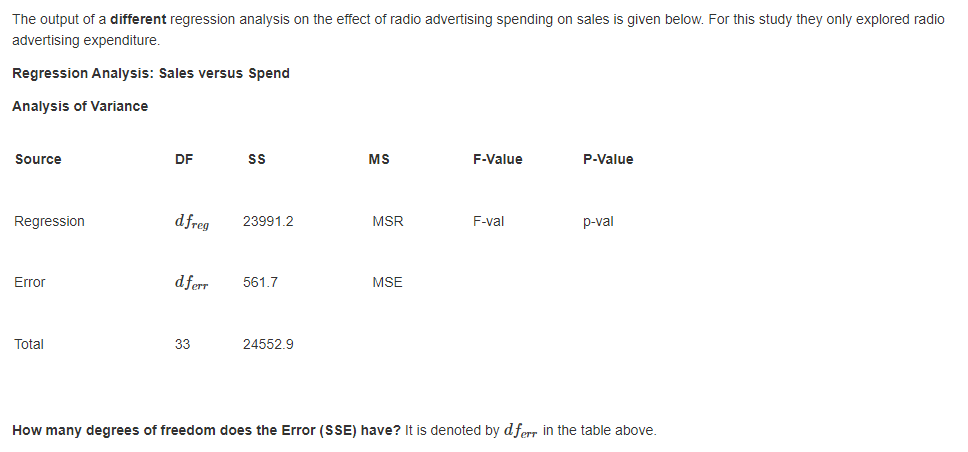
The output of a different regression analysis on the effect of radio advertising spending on sales is given below. For this study they only explored radio advertising expenditure.


Q: A sales manager collected the following data on annual sales for new customer accounts and the…
A: The independent variable is Years of experience. The dependent variable is Annual Sales. We have to…
Q: Suppose that R2 = 0 for a data set. What can you say abouta. SSE?b. SSR?c. the utility of the sample…
A: The formula for coefficient of determination is given as follows:
Q: What is the predicted value for accidents per 1000 licenses for a city that has 13% of its licensed…
A:
Q: A researcher recorded the number of e-mails received in a month and the number of online purchases…
A: In this case, it is required to check whether the slope of the population regression line relating…
Q: Find the slope of the regression line for the following data. 3
A: The regression is the measure that is used to find the unknown value of one variable using the known…
Q: Which of the following data sets could most appropriately be analyzed with a simple linear…
A: We have given the following graphs.
Q: Given a set of data that has the following measures, find the least square regression line
A: The regression line is,…
Q: he following table gives information on the amount of sugar (in grams) and the calorie count in one…
A: Given data, X Y X*Y X*X 6 120 720 36 15 200 3000 225 12 150 1800 144 11 110 1210 121 8…
Q: Suppose that a kitchen cabinet warehouse company would like to be able to predict the area of a…
A: Consider a multiple regression model for the prediction of Area of the kitchen (in square feet) on…
Q: A researcher interested in explaining the level of foreign reserves for the country of Barbados…
A: c) Given: Coeff of (EXP) B=-377.08 stdev = 112.19 The missing value of "*" The t-ratio for the…
Q: The owner of Showtime Movie Theaters, Inc., would like to predict weekly gross revenueas a function…
A: Hi! Thank you for the question, As per the honor code, we are allowed to answer three sub-parts at a…
Q: A study on the amount of rainfall and the quantity of air pollution removed gave the following of…
A: Given Data : X = Rainfall Y = Particulate removed 4.2 128 2.4 123 5.8 118 5.5 120 6 116…
Q: Suppose that R2= 1 for a data set. What can you say abota. SSE? b. SSR? c. the utility of the sample…
A: a)Coefficient of multiple determination:
Q: A researcher interested in explaining the level of foreign reserves for the country of Barbados…
A: (*)= -377.08/112.19 = -3.3611 (**)=> The p-value is .012974.The result is significant at p <…
Q: The LA county board of education regularly collects data on student SAT scores and classifies these…
A: Multple Regression analysis is the corret answer because SAT score is dependent on two or more…
Q: The owner of Showtime Movie Theaters, Inc., used multiple regression analysis to predict gross…
A: a. R2=SSRSST =32.734.9 =0.937 Adj R2=1-1-R2N-1N-p-1, N=sample size and p=number of variables…
Q: Suppose that a kitchen cabinet warehouse company would like to be able to predict the area of a…
A:
Q: The following three problems refer to the data sets displayed below: 8. Which data set has the…
A: The slope of the line is the ratio of the rise to the run, or rise divided by the run.
Q: A recent study by a major financial investment company was interested in determining whether the…
A: The required value will provide by the following table: here, x is %change in profit and y is %…
Q: A researcher interested in explaining the level of foreign reserves for the country of Barbados…
A: a) In theory of statistics, dependent variable is the response variable, where the variation of the…
Q: Find the 95% prediction interval for the average number of sick days an employee will take per year,…
A: From given : Sick Days=14.310162−0.236900(Age)Se=1.682207
Q: In the packaging department of a large aircraft parts distributor, a fairly reliable estimate of…
A: (a) Least square regression equation: The least square regression equation is given below: y^=b0+b1x…
Q: Find the equation of the regression line for the given data. What would be the predicted number of…
A:
Q: Suppose that a kitchen cabinet warehouse company would like to be able to predict the area of a…
A: Given : Coefficients: (Intercept)HeightCabinets Estimate-57.98771.2760.3393 Std.…
Q: A survey conducted by a research team was to investigate how the education level, tenure in current…
A: Solution: 7. From the given information,
Q: For which of the following sets of data points can you reasonably determine a regression line?…
A: Scatterplot: A scatterplot is a graph of data for two quantitative variables of population. Each…
Q: A candy bar manufacturer is interested in trying to estimate how sales are influenced by the price…
A: Step-by-step procedure to find the correlation coefficient using Excel: In Excel sheet, enter Price…
Q: Find the slope of the regression line for the following data.
A: x y x-x y-y (x-x)(y-y) (x-x)2 (y-y)2 1 3 -1.33 1 -1.33 1.7689 1 3 2 0.67 0 0 0.4489 0 3 1 0.67…
Q: The certain study seeks to investigate whether negative life events, family environment, family…
A: Given: Independent/ predictor variables: Negative life events, family environment, family violence,…
Q: A researcher interested in explaining the level of foreign reserves for the country of Barbados…
A: B is the coefficient of OIL so we check the p-value of OIL. p-value= 0.0006 Which is less than…
Q: What is the differed annual expenditures of two families if their annual net incomes are differed by…
A: Let y1 and y2 be the annual expenditures of the familiesand Let x1 and x2 be their net incomes.We…
Q: A candy bar manufacturer is interested in trying to estimate how sales are influenced by the price…
A:
Q: The output of a different regression analysis on the effect of radio advertising spending,…
A: The regression model is y = a0 + a1x1 + a2x2 + a3x3.
Q: A researcher interested in explaining the level of foreign reserves for the country of Barbados…
A: Given Information:
Q: A mail-order business selling personal computer supplies, software and hardware maintains a…
A: Solution: The response variable in the multiple regression line is y: Warehouse Distribution cost…
Q: Number of Days Absent Distance to Work (miles) 8. 3 8. 4 7 6. 8. 6. 10 12 14 14 4 18 Use Microsoft…
A: Let distance to miles be denoted as x, and number of days as y. The data is: x y 1 8 3 5 4…
Q: In the table below ratings data on x = the quality of the speed of execution and y = overall…
A: Excel: Data --> Data analysis -->Regression
Q: It is considered that the number of employees in the enterprise affects the number of production.…
A: Data regarding the number of employees in the enterprise and the number of production is given as:…
Q: If the point representing 64 wins and attendance of 40,786, people per game is removed from the set…
A: Solution : Note : Since we only answer up to 3 sub-parts, we’ll answer the first 3. Please resubmit…
Q: If a scatterplot is created in excel, and a line of regression is fit along with a derived…
A: Scatterplot:A scatterplot is a graph of the paired (x, y) sample data with a horizontal x–axis and a…
Q: A researcher interested in explaining the level of foreign reserves for the country of Barbados…
A:
Q: The regional transit authority for a major metropolitan area wants to determine whetherthere is a…
A: Hey, since there are multiple subparts posted, we will answer first three subparts. If you want any…
Q: What would the consequence be for a regression model if the errors were not homoscedastic?
A:
Q: A researcher interested in explaining the level of foreign reserves for the country of Barbados…
A: B is the coefficient of OIL, For OIL, Ho: B is Statistically significant. H1: B is not…
Q: A researcher interested in explaining the level of foreign reserves for the country of Barbados…
A: β is the associated coefficient of OIL ========================
Q: The owner of Showtime Movie Theaters, Inc., would like to predict weekly gross revenue as a function…
A: Since you have asked multiple question, according to our guidelines we will solve the first question…
Q: A fisheries biologist studying whitefish in a Canadian Lake collected data on the length (in…
A: Here given the results of linear regression . Constants = alpha = 25.55 Coefficient of calories =…

Step by step
Solved in 2 steps

- Find the equation of the regression line for the following data set. x 1 2 3 y 0 3 4A newspaper used an estimated regression equation to describe the relationship between y = error percentage for subjects reading a four-digit liquid crystal display and the independent variables x1 = level of backlight, x2 = character subtense, x3 = viewing angle, and x4 = level of ambient light. From a table given in the article, SSRegr = 21.6, SSResid = 22, and n = 30. What is the value of the test statistic F What is the P-value What is r2 What is SeA study is conducted to determine if there is a relationship between the two variables, blood haemoglobin (Hb) levels and packed cell volumes (PCV) in the female population. A simple linear regression analysis was performed using SPSS. Based on the SPSS output of the ANOVA table, which of the following statements is the CORRECT interpretation? 1. The regression model statistically significantly predicts the blood haemoglobin level. 2. About 39.98 % of variance in Hb is explained by PCV. 3. The regression model does not fit the data. 4. There is significant contribution of Hb towards PCV.
- Mumbai Electronics is planning to extend its marketing region from the western United States to include the midwestern states. In order to predict its sales in this new region, the company has asked you to develop a linear regression of DVD system sales on price, using the following data supplied by the marketing department: Sales 418 384 343 407 432 386 444 427 Price 98 194 231 207 89 255 149 195 a. Use an unbiased estimation procedure to find an estimate of the variance of the error terms in the population regression. b. Use an unbiased estimation procedure to find an estimate of the variance of the least squares estimator of the slope of the population regression line. c. Find a 90% confidence interval for the slope of the population regression line.If there is no significant correlation between the response and explanatory variables, would the slope of the regression line be (a) positive (b) negative (c) zero?The attached results are for a multiple regression study of smartphone addiction (SSA-SV) proneness in relation to 1) Gender 2)Age 3) Anxiety (GAD-7). I just want to clarify what the F-statistic means and the effects of AGE on the F-statistic; given that AGE is statistically significant compared to the other predictor variables.
- Suppose that a kitchen cabinet warehouse company would like to be able to predict the area of a customer’s kitchen using the number of cabinets and the kitchen ceiling height. To do so data is collected on the following variables from a random sample of customers: Area – area of the kitchen in square feet Height – ceiling height in the kitchen (from floor to ceiling) in inches Cabinets – number of cabinets in the kitchen Suppose that a multiple linear regression model was fit to the data and that the following output resulted: Coefficients: (Intercept)HeightCabinets Estimate-57.98771.2760.3393 Std. Error8.63820.26430.1302 t value -6.7134.8282.607 Pr(>|t|)2.75e-074.44e-050.0145 What is the predicted area of a kitchen with a height of 96 inches and 10 cabinets? Report your answer to 1 decimal place. square feetSuppose that a kitchen cabinet warehouse company would like to be able to predict the area of a customer’s kitchen using the number of cabinets and the kitchen ceiling height. To do so data is collected on the following variables from a random sample of customers: Area – area of the kitchen in square feet Height – ceiling height in the kitchen (from floor to ceiling) in inches Cabinets – number of cabinets in the kitchen Suppose that a multiple linear regression model was fit to the data and that the following output resulted: Coefficients: (Intercept)HeightCabinets Estimate-57.98771.2760.3393 Std. Error8.63820.26430.1302 t value -6.7134.8282.607 Pr(>|t|)2.75e-074.44e-050.0145 10 Question 10 This is not a form; we suggest that you use the browse mode and read all parts of the question carefully. Which of the following is the correct interpretation of the coefficient for Cabinets? For a kitchen with a given ceiling height, the average number of cabinets…Suppose that a kitchen cabinet warehouse company would like to be able to predict the area of a customer’s kitchen using the number of cabinets and the kitchen ceiling height. To do so data is collected on the following variables from a random sample of customers: Area – area of the kitchen in square feet Height – ceiling height in the kitchen (from floor to ceiling) in inches Cabinets – number of cabinets in the kitchen Suppose that a multiple linear regression model was fit to the data and that the following output resulted: Coefficients: (Intercept)HeightCabinets Estimate-57.98771.2760.3393 Std. Error8.63820.26430.1302 t value -6.7134.8282.607 Pr(>|t|)2.75e-074.44e-050.0145 Why is the interpretation of the constant term (i.e. "intercept") not meaningful for this example? The predicted area will be negative when the number of cabinets is zero and the height of the kitchen is also zero. But we cannot have a negative area, nor a kitchen ceiling height of 0 inches.…
- . A professor at the University of Alabama was interested in evaluating the relationship between family support and delinquency. Using data collected on 4545 families, the researcher used regression to analyze the relationship. The results are presented below. Variables Entered/Removeda Model Variables Entered Variables Removed Method 1 Family supportb . Enter a. Dependent Variable: Delinquency b. All requested variables entered. Model Summary Model R R Square Adjusted R Square Std. Error of the Estimate 1 .249a .062 .062 1.59168 a. Predictors: (Constant), Family support ANOVAa Model Sum of Squares df Mean Square F Sig. 1 Regression 759.204 1 759.204 299.671 <.001b Residual 11479.107 4531 2.533 Total 12238.311 4532 a. Dependent Variable: Delinquency b. Predictors: (Constant), Family support…A professor at the University of Alabama was interested in evaluating the relationship between family support and delinquency. Using data collected on 4545 families, the researcher used regression to analyze the relationship. The results are presented below. Variables Entered/Removeda Model Variables Entered Variables Removed Method 1 Family supportb . Enter a. Dependent Variable: Delinquency b. All requested variables entered. Model Summary Model R R Square Adjusted R Square Std. Error of the Estimate 1 .249a .062 .062 1.59168 a. Predictors: (Constant), Family support ANOVAa Model Sum of Squares df Mean Square F Sig. 1 Regression 759.204 1 759.204 299.671 <.001b Residual 11479.107 4531 2.533 Total 12238.311 4532 a. Dependent Variable: Delinquency b. Predictors: (Constant), Family support…. A professor at the University of Alabama was interested in evaluating the relationship between family support and delinquency. Using data collected on 4545 families, the researcher used regression to analyze the relationship. The results are presented below. Variables Entered/Removeda Model Variables Entered Variables Removed Method 1 Family supportb . Enter a. Dependent Variable: Delinquency b. All requested variables entered. Model Summary Model R R Square Adjusted R Square Std. Error of the Estimate 1 .249a .062 .062 1.59168 a. Predictors: (Constant), Family support ANOVAa Model Sum of Squares df Mean Square F Sig. 1 Regression 759.204 1 759.204 299.671 <.001b Residual 11479.107 4531 2.533 Total 12238.311 4532 a. Dependent Variable: Delinquency b. Predictors: (Constant), Family support…
