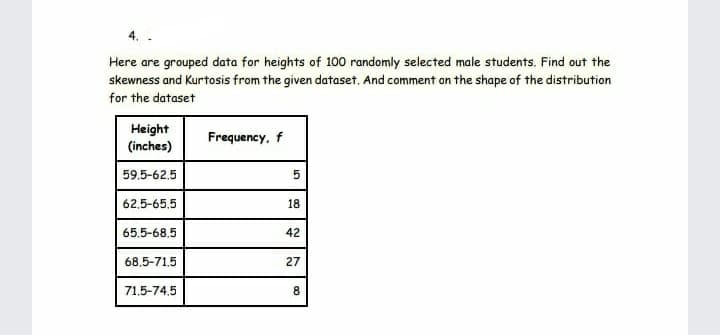
Here are grouped data for heights of 100 randomly selected male students. Find out the skewness and Kurtosis from the given dataset. And comment on the shape of the distribution for the dataset Height (inches) Frequency, f 59.5-62,5 62.5-65.5 18 65.5-68.5 42 68.5-71.5 27 71.5-74.5 8. 5.


Q: look at the t-statistics for the relevant coefficients. analyze the standard error of estimated…
A: Polynomial regression is a type of Linear regression where simply because of the Non-straight…
Q: QUESTION 4 Which one of the following statements is true for a linear regression model with…
A: Answer - "Thank you for submitting the questions. But, we are authorized to solve one question at a…
Q: A researcher has estimated the relationship between salaries of 100 selected employees of an…
A: A. Let the intercept be denoted by B0 Step 1: Form Null and Alternative Hypothesis Null Hypothesis :…
Q: Given the following regression output, Predictor Coefficient SE Coefficient t p-value…
A: Linear regression is a model delineating the linear association between the independent variables…
Q: For each of the following variables, determine whether the variable is categorical or numerical. If…
A: Disclaimer :- as you posted multipart questions we are supposed to solve the first 3 questions only.…
Q: Four hundred driver's license applicants were randomly selected and asked whether they passed their…
A:
Q: The height (in inches) of a random sample of 28 players in NCAA Division 1 basketball teams is shown…
A: Sum of squared x minus n times squared mean, the formula is part of statistics.
Q: 8. Which of the following best describes the linear probability model? The model is the application…
A: When talking about regression model, there are numerous forms of a regression to estimate the…
Q: Simple Regression Sales Revenue Year Product Price (P) (millions of pesos) 1 1.20 0.95 1.50 0.93 3…
A: Regression is a statistical technique used in finance, investing, and other fields to identify the…
Q: The birthweight (in kg of 55 babies are tabulated in the frequency distribution below: Birthweight…
A: Birthweight (kg) Frequency Relative frequency (2-2.5) 11 11/55=0.2 Total n=55 Given:Total…
Q: Consider the following frequency distribution:Class Frequency0 < 10…
A: In economics, the frequency distribution can be categorised under the statistical economics where…
Q: Consider the simple regression model Yi = B2x1 + & Find the least squares estimator b, and show Eŷ,…
A:
Q: A car company wants to know the monthly sales made in ($000), based on the brand of vehicle. The…
A:
Q: Paw Patrol Inc. manufactures toys for kids from 1 to 10 years old. The summary of toy sales by month…
A: Year Period Demand Forecast Mad 2017 Sep 19400 Oct 18300 Nov 17200 Dec…
Q: For the regression Y = B0+B1X+u, the variance u is conditional homoskedastic. Is it correct if you…
A: Solution: The concept of regression models, the errors of a regression model, the assumptions of…
Q: ous cross-country comparisons, but that does not mean that we have to restrict our analysis to…
A: To calculate the average growth rate of your company, you first need to divide the present by the…
Q: For the following time series plots, explain what type of transformation, if any, would make the…
A: Probability is the measure of the possibility that an event will occur. Probability can be expressed…
Q: U.S. Population The U.S. population can be modeledby the function y = 165.6x1.345, where y is in…
A: In order to define whether a function is concave upward or concave downward, the slope of the…
Q: Jack is a discus thrower and hopes to make it to the Olympics some day. He has researched the…
A: A line of best fit is a straight line that is the best estimate of the given arrangement of…
Q: Sppose we have collected a sample with following characteristics: Total observation = 12 f 20 y = 10…
A: The correlation coefficient measures the degree of association between the two variables. The…
Q: Based on 1337 data points, the following equation was estimated using OLS. From this fragment of…
A:
Q: he mean squared error of a regression is: Equal to R². O Equal to Adjusted R?. O A measure of fit. O…
A: The mean squared error of a regression is : Equal to R2.
Q: What are the properties of Ordinary Least Squares (OLS) estimators in basic econometrics? Discuss.…
A: Linear regression model is an approach of showcasing relationship between dependent variable and one…
Q: What is the size of the error term for the observation indicated by the arrow in the graph below? Y…
A: The size of the error term basically measures the difference in the actual value of the dependent…
Q: The quadrant on which IS and LM are plotted is known as IY space? true or false
A: IS line shows the goods market equilibrium and it is downward sloping curve which shows Inverse…
Q: Given the regression equationY = -50 + 12Xa. What is the change in Y when X changes by +3?b. What is…
A: Since we only answer up to 3 sub-parts, we’ll answer the first 3. Please resubmit the question and…
Q: Consider the following data:
A: Since the question you have posted consists of multiple parts, we will answer the first question for…
Q: Use General Linear Process to determine the the autocovariance function of mean funchon and ARca)…
A: A function is a formula that expresses one variable in terms of another.The phrase "y is a function…
Q: This scatter plot shows the relationship between the number of sweatshirts sold and the temperature…
A: The correct answer is given in the second step .
Q: You have noticed that paying higher wages attracts more productive employees. However, you are…
A: In the labor market, the market forces of demand and supply of labor determine the equilibrium wage…
Q: A regression of average weekly earnings (AWE, measured in dollars) on age(measured in years) using a…
A: Since, you have asked multiple question. We'll solve first three parts i.e a, b, c. If you want any…
Q: Southern States Bank and Trust monitors its drive-thru service times electronically to ensure that…
A:
Q: Consider the following Stata regression output (some values are deliberately removed). Variable |…
A: Ans: The required values from the stata regression output table is given as under Model : SS = 2.28…
Q: e (in feet) traveled by a baseball, in degrees) the baseball was hit, or. ent Variable: DISTANCE…
A: *Answer:
Q: This exercise refers to the drunk driving panel data regression, summarizedin Regression analysis of…
A: "Since you have posted a question with multiple sub-parts, we will solve first three sub-parts for…
Q: relationship between shot quality and points per game for a sample c The data is a panel dataset…
A: Linear regression is a straight methodology for demonstrating the connection between a scalar…
Q: b) The consumer expenditure on automobiles in a particular developing country is estimated from a…
A: The mean of your estimate plus and minus the variation in that estimate is the confidence interval.…
Q: Suppose that you have the following model and data to estimate the following equation; Nobs…
A: This is a regression equation: Y=B0+B1X2+B2X3 Here, Y-dependent variable B0-Intercept B1 and B2- OLS…
Q: A random sample of data for 7 days of operation produced the following (price, quantity) data…
A: Hi! Thank you for the question, As per the honor code, we are allowed to answer three sub-parts at a…
Q: 4. Researcher is using data for a sample of 100 household to estimate the relation between daily…
A: We have regression equation Y= b0 +b1X
Q: Prepare a scatter plot of the following data:(5, 53) (21, 65) (14, 48) (11, 66) (9, 46) (4, 56)(7,…
A: The data set is: X Y 5 53 21 65 14 48 11 66 9 46 4 56 7 53 21 57 17 49 14 66…
Q: In the model Y = B o + ß 1X 1 + B 2X 2 + ɛ, which of these parameters represents a coefficient of an…
A: Answer: Correct option: (c) the β1 Explanation: β1 is the coefficient of the independent variable…
Q: Dependent Variable: SP_IN DEX Method: Least Squares Date: 11/04/21 Time: 22:47 Sample: 1990 1996…
A: Model The regression equation becomes: SP_INDEX=B0+B1CPI+u SP_INDEX=-1211.20+11.62442CPI+u Here B0…
Q: How can we say that Sample Average is the Efficient Linear Estimator of E(Y)?
A: To show that Sample average is the efficient linear estimator of E(Y), we consider the following a…
Q: (c) Diberi Jadual 3 Given Table 3 Jadual 3 Table 3 Dependent Variable: GNIG Method: Least Squares…
A: Ordinary least square method is the method of regressing dependent variable on independent variable.…
Q: Simple Regression Sales Revenue Year Product Price (P) (millions of pesos) 1 1.20 0.95 1.50 0.93 3…
A: Dependent Variable: Sales Revenue (y) Independent Variable: Product Price (x) Regression Equation:…
Q: Consumption (thousands of dollars) Income (thousands of dollars) 20 18 18 13 27 21 36 27 37 26 45 36…
A: The Keynesian consumption function establishes a relationship between the total consumption of each…
Q: Construct a 95% confidence interval for the average value of y for the following data. Use x = 25,…
A:
Q: Based on 1337 data points, the following equation was estimated using OLS.From this fragment of data…
A: Given: Ghat: To Find: The residual for 444th data point:
Q: Setting: Grapple, Inc. is a leading seller of laptop personal computers. However, they want to…
A: “Since you have posted a question with multiple sub-parts, we will solve the first three sub-parts…


Trending now
This is a popular solution!

Step by step
Solved in 2 steps


- In a study aimed at creating reference values, abdominal circumference (measured in cm) was measured in adult men. It was found that the relationship to age could be described as abdominal circumference = 82 + 0.3 x age a) What is the analysis that produces such a formula called? b) At what age is the average abdominal circumference 100 cm?Suppose that the government wants to estimate the effect of PKH on children's height usine WHO's height-for-age metric. Using administrative and surveydata, a researcher evaluates the impact of PKH using the following specification: (image insert) 1. What is the expected sign of beta? What assumption needed to obtain an unbiased estimate of beta 1? 2. is the assumption sensible? what are the consequence of violating the assumption! Discuss whether the estimated coefficient beta 1, positively or negatively bias? 5. do you think adding variables would fulfill the assumption?what is stationary and unit root test mean in time sires econometrics? Clearly explain in détail why logarthmic and dummy variables are regularly used in Time series Econometrics ?
- et R2unrestricted and R2restricted be 0.54 and 0.30 respectively. The difference between the unrestricted and the restricted model is that you have imposed two restrictions. The number of regressors in the unrestricted model is 5. There are 500 observations. The F-statistic (under the assumption of homoskedasticity) in this case is 1. 4.61 2. 8.01 3. 98.5 4. 128.910- What type of data does the data obtained by temperature measurements fall under?I. Interval dataII. Quantitative continuous dataIII. Proportional dataIV. Quantitative discrete data A) II B) I -II C) I - III - IV D) IV E) III - IIWe are studying the factors that contribute to unemployment at an individual level. UE, unemployment, is our dependent variable and it is a binary variable that takes the value 1 if an individual is unemployed and 0 if they are employed. We have a random sample and we estimate the following model: UE^= 0.508−0.051educ−0.023urban+0.005age(0.122) (0.012) (0.005) (0.002)n=6214, R2=0.474 where educ = an individual’s years of education urban = a dummy equal to 1 if the individual lives in an urban area and 0 otherwise age = an individual’s age in years What is the correct interpretation of the estimated coefficient on education?
- A wedding photographer made $500 on average in the 5 years it has been operational. Asample of 12 months were analyzed and it was found that he made an average of $620.i. Does the value $500 refer to the parameter or to the statistic? ii. Is the value $620 a parameter or a statistic? iii. State two advantages of using a sample statistic rather than a parameter.A regression of average weekly earnings (AWE, measured in dollars) on age(measured in years) using a random sample of college-educated full-timeworkers aged 25–65 yields the following: AWE = 696.7 + 9.6 X Age, R2 = 0.023, SER = 624.1.a. Explain what the coefficient values 696.7 and 9.6 mean.b. The standard error of the regression (SER) is 624.1. What are the unitsof measurement for the SER? (Dollars? Years? Or is SER unit-free?)c. The regression R2 is 0.023. What are the units of measurement for theR2? (Dollars? Years? Or is R2 unit-free?)d. What does the regression predict will be the earnings for a 25-year-oldworker? For a 45-year-old worker?e. Will the regression give reliable predictions for a 99-year-old worker?Why or why not?f. Given what you know about the distribution of earnings, do youthink it is plausible that the distribution of errors in the regressionis normal? (Hint: Do you think that the distribution is symmetric orskewed? What is the smallest value of earnings,…Question 29 Suppose that in general the size of a student's class is related to the student's parents' annual income. Does this mean that parental income would be a good instrumental variable for class, size? Why or why not? Question 30 Now imagine our random sample of data is on students living in the Newcastle reeion of NSW. Unfortunately a major earthquake hits the Newcastle region early in the school year, Some Newcastle schools are forced to close for the rest of the school year to undertake repairs. Those closest to the earthquake epicentre are the most severely affected and are more likely to need to close for repairs. Some schools need to "double up" on the mumber of students in elasses to absorb those students whose schools have been closed for repairs. This temporarily increases class sizes at these schools. Conveniently for our study, the test score data is collected at the end of the school year in which the earthquake occured. Carefully explain in detail…
- How do we calculate mean deviation?Discuss its significance and use in variousconcepts of statistics. How it differs fromquartile deviationA government study found that people who eat chocolate frequently weighless than people who don’t. Researchers questioned 1000 individuals fromCalifornia between the ages of 20 and 85 about their eating habits, andmeasured their weight and height. On average, participants ate chocolatetwice a week and had a body mass index (BMI) of 28. There was anobserved difference of five to seven pounds in weight between those whoate chocolate five times a week and those who did not eat any chocolate atall, with the chocolate eaters weighing less on average. Frequent chocolateeaters also consumed more calories, on average, than people who consumedless chocolate. Based on this summary, would you recommend thatAmerican’s who do not presently eat chocolate, consider eating chocolateup to five times a week if they want to lose weight? Why or why not?Explain.Suppose you apply an estimator to sample data and you get an estimate of 5 forwhatever sample you draw from the population. Is this estimator the most efficient because itsvariance is zero? Why or why not?