Consider the daily market for hot dogs in a small city. Suppose that this market is in long-run competitive equilibrium, with many hot dog stands in the city, each one selling the same kind of hot dogs. Therefore, each vendor is a price taker and possesses no market power. The following graph shows the demand (D) and supply curves (SMC) in the market for hot dogs. Place the black point (plus symbol) on the graph to indicate the market price and quantity that will result from perfect competition. PRICE AND COSTS (Dollars per hot dog) 5.0 4.5 4.0 3.5 3.0 2.5 2.0 1.5 1.0 0.5 0 0 50 Perfect Competition S-MC D 100 150 200 250 300 3:50 400 QUANTITY (Hot dogs) 450 500 PC Outcome
Consider the daily market for hot dogs in a small city. Suppose that this market is in long-run competitive equilibrium, with many hot dog stands in the city, each one selling the same kind of hot dogs. Therefore, each vendor is a price taker and possesses no market power. The following graph shows the demand (D) and supply curves (SMC) in the market for hot dogs. Place the black point (plus symbol) on the graph to indicate the market price and quantity that will result from perfect competition. PRICE AND COSTS (Dollars per hot dog) 5.0 4.5 4.0 3.5 3.0 2.5 2.0 1.5 1.0 0.5 0 0 50 Perfect Competition S-MC D 100 150 200 250 300 3:50 400 QUANTITY (Hot dogs) 450 500 PC Outcome
Microeconomics: Private and Public Choice (MindTap Course List)
16th Edition
ISBN:9781305506893
Author:James D. Gwartney, Richard L. Stroup, Russell S. Sobel, David A. Macpherson
Publisher:James D. Gwartney, Richard L. Stroup, Russell S. Sobel, David A. Macpherson
Chapter9: Price Takers And The Competitive Process
Section: Chapter Questions
Problem 16CQ
Related questions
Question
100%
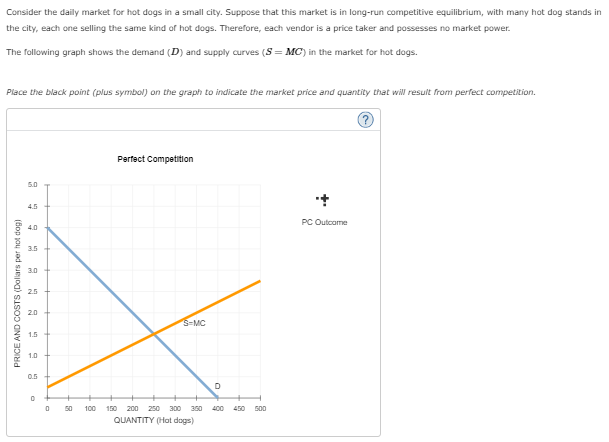
Consider the daily market for hot dogs in a small city. Suppose that this market is in long-run competitive equilibrium, with many hot dog stands in the city, each one selling the same kind of hot dogs. Therefore, each vendor is a price taker and possesses no market power.
The following graph shows the demand (D�) and supply curves (S=MC�=MC) in the market for hot dogs.
Place the black point (plus symbol) on the graph to indicate the market price and quantity that will result from perfect competition.
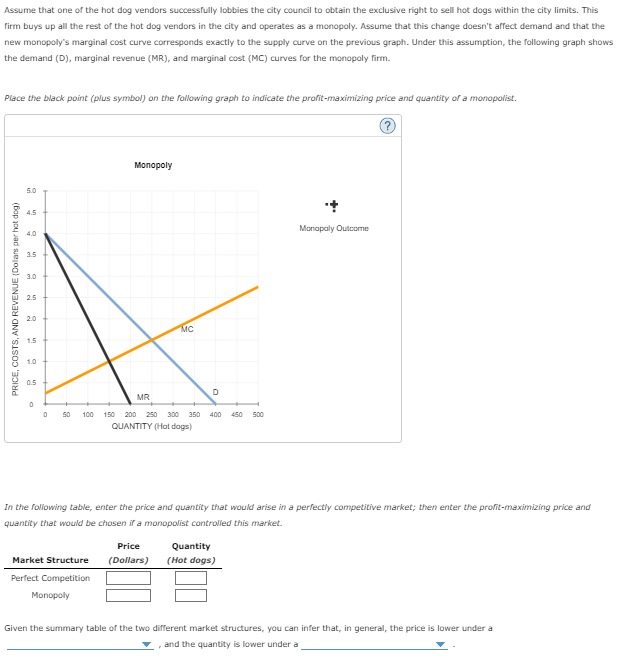
Assume that one of the hot dog vendors successfully lobbies the city council to obtain the exclusive right to sell hot dogs within the city limits. This firm buys up all the rest of the hot dog vendors in the city and operates as a monopoly . Assume that this change doesn't affect demand and that the new monopoly's marginal cost curve corresponds exactly to the supply curve on the previous graph. Under this assumption, the following graph shows the demand (D), marginal revenue (MR), and marginal cost (MC) curves for the monopoly firm.
Place the black point (plus symbol) on the following graph to indicate the profit-maximizing price and quantity of a monopolist.
In the following table, enter the price and quantity that would arise in a perfectly competitive market; then enter the profit-maximizing price and quantity that would be chosen if a monopolist controlled this market.
|
Market Structure
|
Price
|
Quantity
|
|---|---|---|
|
(Dollars)
|
(Hot dogs)
|
|
| Perfect Competition |
|
|
| Monopoly |
|
|
Given the summary table of the two different market structures, you can infer that, in general, the price is lower under a _________ , and the quantity is lower under a ___________ .

Transcribed Image Text:Assume that one of the hot dog vendors successfully lobbies the city council to obtain the exclusive right to sell hot dogs within the city limits. This
firm buys up all the rest of the hot dog vendors in the city and operates as a monopoly. Assume that this change doesn't affect demand and that the
new monopoly's marginal cost curve corresponds exactly to the supply curve on the previous graph. Under this assumption, the following graph shows
the demand (D), marginal revenue (MR), and marginal cost (MC) curves for the monopoly firm.
Place the black point (plus symbol) on the following graph to indicate the profit-maximizing price and quantity of a monopolist.
PRICE, COSTS, AND REVENUE (Dolars per hot dog)
5.0
4.5
3.0
2.5
1.5
1.0
0
0
Monopoly
MR
50 100 150 200 250 300 350
QUANTITY (Hot dogs)
Market Structure
Perfect Competition
Monopoly
MC
Price
(Dollars)
D
400 450
500
In the following table, enter the price and quantity that would arise in a perfectly competitive market; then enter the profit-maximizing price and
quantity that would be chosen if a monopolist controlled this market.
Quantity
(Hot dogs)
+
Monopoly Outcome
Given the summary table of the two different market structures, you can infer that, in general, the price is lower under a
, and the quantity is lower under a

Transcribed Image Text:Consider the daily market for hot dogs in a small city. Suppose that this market is in long-run competitive equilibrium, with many hot dog stands in
the city, each one selling the same kind of hot dogs. Therefore, each vendor is a price taker and possesses no market power.
The following graph shows the demand (D) and supply curves (SMC) in the market for hot dogs.
Place the black point (plus symbol) on the graph to indicate the market price and quantity that will result from perfect competition.
PRICE AND COSTS (Dollars per hot dog)
5.0
4.5
4.0
3.5
3.0
2.5
2.0
1.5
1.0
0.5
0
0
50
Perfect Competition
S-MC
D
100 150 200 250 300 3:50 400
QUANTITY (Hot dogs)
450 500
PC Outcome
Expert Solution
Step 1
A perfectly competitive firm is a price taker as there are many firms producing identical goods. It maximizes profit by producing at D=MC
A monopoly is a single firm in the market. It has the market power. It maximises profit by producing at MR=MC
Trending now
This is a popular solution!
Step by step
Solved in 2 steps with 1 images

Knowledge Booster
Learn more about
Need a deep-dive on the concept behind this application? Look no further. Learn more about this topic, economics and related others by exploring similar questions and additional content below.Recommended textbooks for you

Microeconomics: Private and Public Choice (MindTa…
Economics
ISBN:
9781305506893
Author:
James D. Gwartney, Richard L. Stroup, Russell S. Sobel, David A. Macpherson
Publisher:
Cengage Learning

Economics: Private and Public Choice (MindTap Cou…
Economics
ISBN:
9781305506725
Author:
James D. Gwartney, Richard L. Stroup, Russell S. Sobel, David A. Macpherson
Publisher:
Cengage Learning


Microeconomics: Private and Public Choice (MindTa…
Economics
ISBN:
9781305506893
Author:
James D. Gwartney, Richard L. Stroup, Russell S. Sobel, David A. Macpherson
Publisher:
Cengage Learning

Economics: Private and Public Choice (MindTap Cou…
Economics
ISBN:
9781305506725
Author:
James D. Gwartney, Richard L. Stroup, Russell S. Sobel, David A. Macpherson
Publisher:
Cengage Learning
