Consider the data. 23 4 3 8 6. 10 15 SSE (a) Compute the mean square error using equation s = MSE = (Round your answer to two decimal places.) n-2 SSE (b) Compute the standard error of the estimate using equation S = V MSE = (Round your answer to three decimal places.) n- 2 (c) Compute the estimated standard deviation of b, using equation S. = . (Round your answer to three decimal places.) (d) Use the t test to test the following hypotheses (a = 0.05): %3D Ho:ßq = 0 %3! Find the value of the test statistic. (Round your answer to three decimal places.) Find the p-value. (Round your answer to four decimal places.) p-value = State your conclusion. O Do not reject Ho. We cannot conclude that the relationship between x and y is significant. O Do not reject Ho. We conclude that the relationship between x and y is significant. O Reject Ha. We cannot conclude that the relationship between x and y is significant. O Reject H. We conclude that the relationship between x and y is significant. e) Use the F test to test the hypotheses in part (d) at a 0.05 level of significance. Present the results in the analysis of variance table format. Set up the ANOVA table. (Round your values for MSE and F to two decimal places, and your p-value to three decimal places.) Mean Source of Variation Degrees of Freedom Sum p-value of Squares Square Regression Error Total Find the value of the test statistic. (Round your answer to two decimal places.) Find the p-value. (Round your answer to three decimal places.) p-value = State your conclusion. O Do not reject Ho. We conclude that the relationship between x and y is significant. O Reject Ho. We cannot conclude that the relationship between x and y is significant. Reject Ho. We conclude that the relationship between x and y is significant. O Do not reject Ho. We cannot conclude that the relationship between x and y is significant.
Consider the data. 23 4 3 8 6. 10 15 SSE (a) Compute the mean square error using equation s = MSE = (Round your answer to two decimal places.) n-2 SSE (b) Compute the standard error of the estimate using equation S = V MSE = (Round your answer to three decimal places.) n- 2 (c) Compute the estimated standard deviation of b, using equation S. = . (Round your answer to three decimal places.) (d) Use the t test to test the following hypotheses (a = 0.05): %3D Ho:ßq = 0 %3! Find the value of the test statistic. (Round your answer to three decimal places.) Find the p-value. (Round your answer to four decimal places.) p-value = State your conclusion. O Do not reject Ho. We cannot conclude that the relationship between x and y is significant. O Do not reject Ho. We conclude that the relationship between x and y is significant. O Reject Ha. We cannot conclude that the relationship between x and y is significant. O Reject H. We conclude that the relationship between x and y is significant. e) Use the F test to test the hypotheses in part (d) at a 0.05 level of significance. Present the results in the analysis of variance table format. Set up the ANOVA table. (Round your values for MSE and F to two decimal places, and your p-value to three decimal places.) Mean Source of Variation Degrees of Freedom Sum p-value of Squares Square Regression Error Total Find the value of the test statistic. (Round your answer to two decimal places.) Find the p-value. (Round your answer to three decimal places.) p-value = State your conclusion. O Do not reject Ho. We conclude that the relationship between x and y is significant. O Reject Ho. We cannot conclude that the relationship between x and y is significant. Reject Ho. We conclude that the relationship between x and y is significant. O Do not reject Ho. We cannot conclude that the relationship between x and y is significant.

MATLAB: An Introduction with Applications
6th Edition
ISBN:9781119256830
Author:Amos Gilat
Publisher:Amos Gilat
Chapter1: Starting With Matlab
Section: Chapter Questions
Problem 1P

Related questions
Question
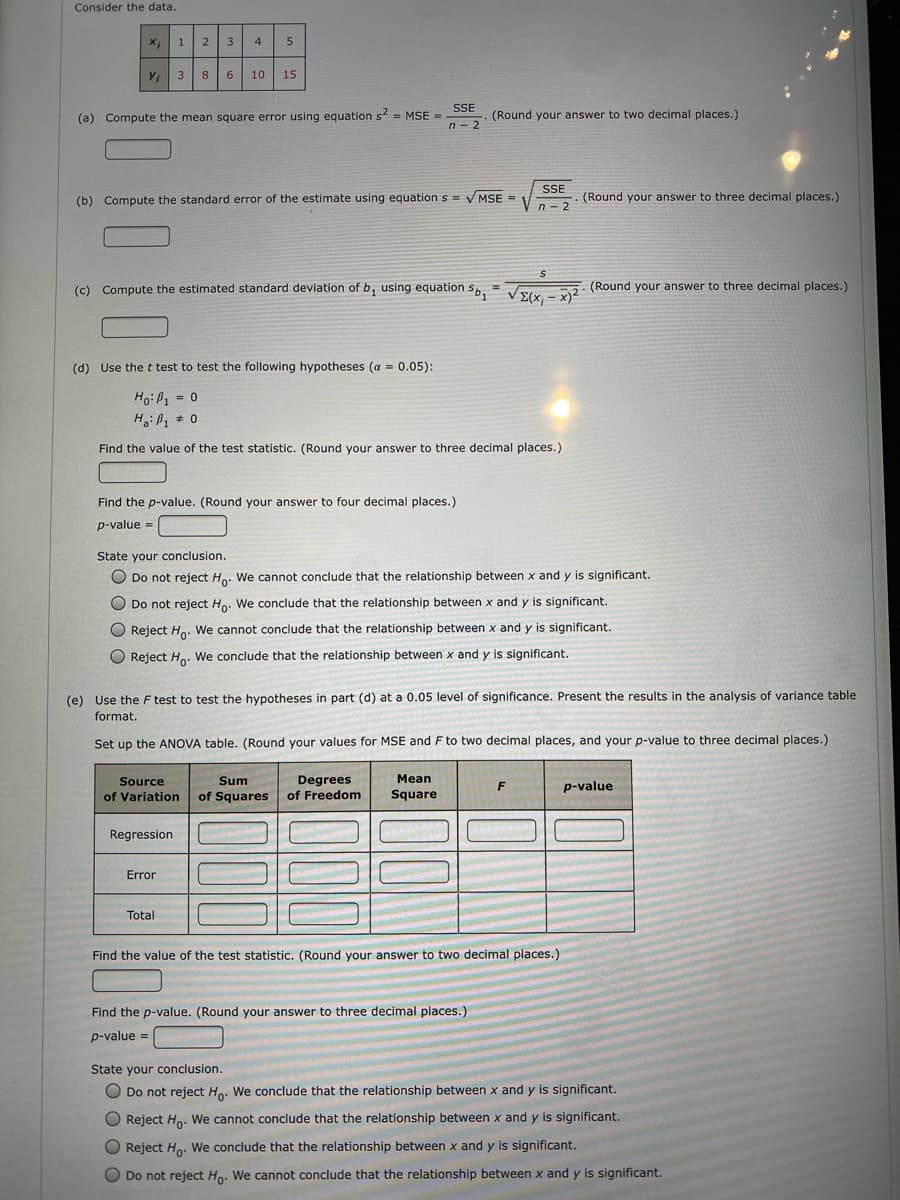
Transcribed Image Text:Consider the data.
1
2
3
4
5
10
15
SSE
(a) Compute the mean square error using equation s = MSE =
(Round your answer to two decimal places.)
n - 2
SSE
(b) Compute the standard error of the estimate using equation S = V MSE =
(Round your answer to three decimal places.)
n - 2
(c) Compute the estimated standard deviation of b, using equation sS. = . (Round your answer to three decimal places.)
E(x, - x)2
(d) Use the t test to test the following hypotheses (a = 0.05):
Ho:B1 = 0
Hoißa
Find the value of the test statistic. (Round your answer to three decimal places.)
Find the p-value. (Round your answer to four decimal places.)
p-value =
%3D
State your conclusion.
O Do not reject Ho. We cannot conclude that the relationship between x and y is significant.
O Do not reject Ho. We conclude that the relationship between x and y is significant.
O Reject H.. We cannot conclude that the relationship between x and y is significant.
O Reject Ho. We conclude that the relationship between x and y is significant.
(e) Use the F test to test the hypotheses in part (d) at a 0.05 level of significance. Present the results in the analysis of variance table
format.
Set up the ANOVA table. (Round your values for MSE and F to two decimal places, and your p-value to three decimal places.)
Mean
Degrees
of Freedom
Source
Sum
p-value
of Variation
of Squares
Square
Regression
Error
Total
Find the value of the test statistic. (Round your answer to two decimal places.)
Find the p-value. (Round your answer to three decimal places.)
p-value =
State your conclusion.
O Do not reject Ho. We conclude that the relationship between x and y is significant.
O Reject Ho. We cannot conclude that the relationship between x and y is significant.
Reject Ho. We conclude that the relationship between x and y is significant.
O Do not reject Ho. We cannot conclude that the relationship between x and y is significant.
Expert Solution
This question has been solved!
Explore an expertly crafted, step-by-step solution for a thorough understanding of key concepts.

This is a popular solution!

Trending now
This is a popular solution!

Step by step
Solved in 2 steps with 1 images

Recommended textbooks for you
MATLAB: An Introduction with Applications
Statistics
ISBN:
9781119256830
Author:
Amos Gilat
Publisher:
John Wiley & Sons Inc

Probability and Statistics for Engineering and th…
Statistics
ISBN:
9781305251809
Author:
Jay L. Devore
Publisher:
Cengage Learning

Statistics for The Behavioral Sciences (MindTap C…
Statistics
ISBN:
9781305504912
Author:
Frederick J Gravetter, Larry B. Wallnau
Publisher:
Cengage Learning
MATLAB: An Introduction with Applications
Statistics
ISBN:
9781119256830
Author:
Amos Gilat
Publisher:
John Wiley & Sons Inc
Probability and Statistics for Engineering and th…
Statistics
ISBN:
9781305251809
Author:
Jay L. Devore
Publisher:
Cengage Learning
Statistics for The Behavioral Sciences (MindTap C…
Statistics
ISBN:
9781305504912
Author:
Frederick J Gravetter, Larry B. Wallnau
Publisher:
Cengage Learning

Elementary Statistics: Picturing the World (7th E…
Statistics
ISBN:
9780134683416
Author:
Ron Larson, Betsy Farber
Publisher:
PEARSON

The Basic Practice of Statistics
Statistics
ISBN:
9781319042578
Author:
David S. Moore, William I. Notz, Michael A. Fligner
Publisher:
W. H. Freeman

Introduction to the Practice of Statistics
Statistics
ISBN:
9781319013387
Author:
David S. Moore, George P. McCabe, Bruce A. Craig
Publisher:
W. H. Freeman