Consider the data. Xi Yi 2 6 9 13 20 8 18 7 (a) What is the value of the standard error of the estimate? (Round your 8.333 (b) Test for a significant relationship by using the t test. Use α = 0.05. State the null and alternative hypotheses. Ho: P₁ ≥ 0 Ha: B₁ <0 Ho: B₁ = 0 Ha: B₁ * 0 # = 0 O Ho: Po= Ha: Bo #0 O Ho: B₁ * 0 Ha: P₁ = 0 25 22 Ho: Bo # 0 Ha: Bo = 0 Find the value of the test statistic. (Round your answer to three deci 0.824 X Find the p-value. (Round your answer to four decimal places.) p-value = 0.4966 X
Consider the data. Xi Yi 2 6 9 13 20 8 18 7 (a) What is the value of the standard error of the estimate? (Round your 8.333 (b) Test for a significant relationship by using the t test. Use α = 0.05. State the null and alternative hypotheses. Ho: P₁ ≥ 0 Ha: B₁ <0 Ho: B₁ = 0 Ha: B₁ * 0 # = 0 O Ho: Po= Ha: Bo #0 O Ho: B₁ * 0 Ha: P₁ = 0 25 22 Ho: Bo # 0 Ha: Bo = 0 Find the value of the test statistic. (Round your answer to three deci 0.824 X Find the p-value. (Round your answer to four decimal places.) p-value = 0.4966 X

MATLAB: An Introduction with Applications
6th Edition
ISBN:9781119256830
Author:Amos Gilat
Publisher:Amos Gilat
Chapter1: Starting With Matlab
Section: Chapter Questions
Problem 1P

Related questions
Question
6
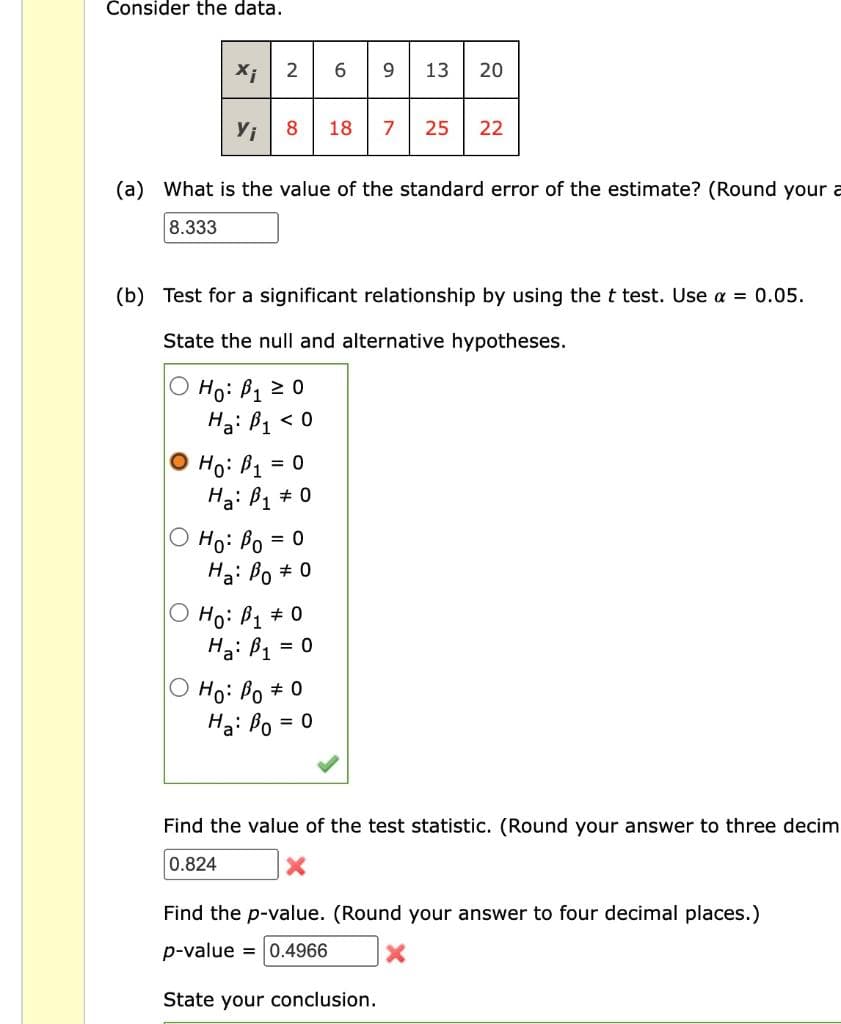
Transcribed Image Text:Consider the data.
Xi
Yi
2
8 18 7
Ho: B₁ ≥ 0
Ha: B₁ <0
O Ho: Po
Ho: P₁ =
= 0
Ha: B₁ * 0
(a) What is the value of the standard error of the estimate? (Round your a
8.333
(b) Test for a significant relationship by using the t test. Use α = 0.05.
State the null and alternative hypotheses.
= 0
Ha: Bo #
# 0
Ho: B₁ * 0
Ha: B₁
6
= 0
9
Ho: Bo = 0
Ha: Bo
= 0
13 20
25 22
Find the value of the test statistic. (Round your answer to three decim
0.824
X
Find the p-value. (Round your answer to four decimal places.)
p-value = 0.4966
X
State your conclusion.
Expert Solution
This question has been solved!
Explore an expertly crafted, step-by-step solution for a thorough understanding of key concepts.

Step by step
Solved in 3 steps

Recommended textbooks for you
MATLAB: An Introduction with Applications
Statistics
ISBN:
9781119256830
Author:
Amos Gilat
Publisher:
John Wiley & Sons Inc

Probability and Statistics for Engineering and th…
Statistics
ISBN:
9781305251809
Author:
Jay L. Devore
Publisher:
Cengage Learning

Statistics for The Behavioral Sciences (MindTap C…
Statistics
ISBN:
9781305504912
Author:
Frederick J Gravetter, Larry B. Wallnau
Publisher:
Cengage Learning
MATLAB: An Introduction with Applications
Statistics
ISBN:
9781119256830
Author:
Amos Gilat
Publisher:
John Wiley & Sons Inc
Probability and Statistics for Engineering and th…
Statistics
ISBN:
9781305251809
Author:
Jay L. Devore
Publisher:
Cengage Learning
Statistics for The Behavioral Sciences (MindTap C…
Statistics
ISBN:
9781305504912
Author:
Frederick J Gravetter, Larry B. Wallnau
Publisher:
Cengage Learning

Elementary Statistics: Picturing the World (7th E…
Statistics
ISBN:
9780134683416
Author:
Ron Larson, Betsy Farber
Publisher:
PEARSON

The Basic Practice of Statistics
Statistics
ISBN:
9781319042578
Author:
David S. Moore, William I. Notz, Michael A. Fligner
Publisher:
W. H. Freeman

Introduction to the Practice of Statistics
Statistics
ISBN:
9781319013387
Author:
David S. Moore, George P. McCabe, Bruce A. Craig
Publisher:
W. H. Freeman