Consider the fictitious Single Sample OC curve given below. If the lot size is N = 460, value of c? %3D 1.0005 1.0003 1.0001
Consider the fictitious Single Sample OC curve given below. If the lot size is N = 460, value of c? %3D 1.0005 1.0003 1.0001

College Algebra (MindTap Course List)
12th Edition
ISBN:9781305652231
Author:R. David Gustafson, Jeff Hughes
Publisher:R. David Gustafson, Jeff Hughes
Chapter8: Sequences, Series, And Probability
Section8.7: Probability
Problem 6E: List the sample space of each experiment. Tossing three coins

Related questions
Question
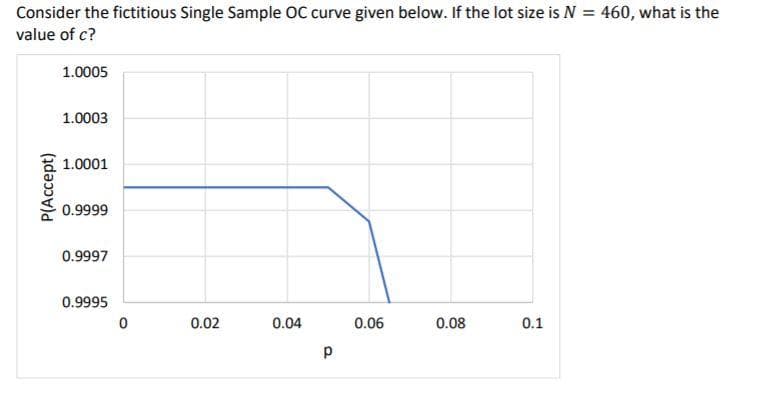
Transcribed Image Text:Consider the fictitious Single Sample OC curve given below. If the lot size is N = 460, what is the
value of c?
1.0005
1.0003
1.0001
0.9999
0.9997
0.9995
0.02
0.04
0.06
0.08
0.1
P(Accept)
Expert Solution
This question has been solved!
Explore an expertly crafted, step-by-step solution for a thorough understanding of key concepts.

Step by step
Solved in 2 steps with 1 images

Recommended textbooks for you
College Algebra (MindTap Course List)
Algebra
ISBN:
9781305652231
Author:
R. David Gustafson, Jeff Hughes
Publisher:
Cengage Learning

College Algebra (MindTap Course List)
Algebra
ISBN:
9781305652231
Author:
R. David Gustafson, Jeff Hughes
Publisher:
Cengage Learning