Using the stem and leaf diagram in Exhibit 1, i. Form a frequency table by identifying the class intervals implicitly. Using the table created in 2ci) above, ii. Calculate the sample mean iii. Calculate the sample variance
Using the stem and leaf diagram in Exhibit 1, i. Form a frequency table by identifying the class intervals implicitly. Using the table created in 2ci) above, ii. Calculate the sample mean iii. Calculate the sample variance

Algebra & Trigonometry with Analytic Geometry
13th Edition
ISBN:9781133382119
Author:Swokowski
Publisher:Swokowski
Chapter10: Sequences, Series, And Probability
Section10.8: Probability
Problem 64E

Related questions
Question
Using the stem and leaf diagram in Exhibit 1,
i. Form a frequency table by identifying the class intervals implicitly.
Using the table created in 2ci) above,
ii. Calculate the sample mean
iii. Calculate the sample variance
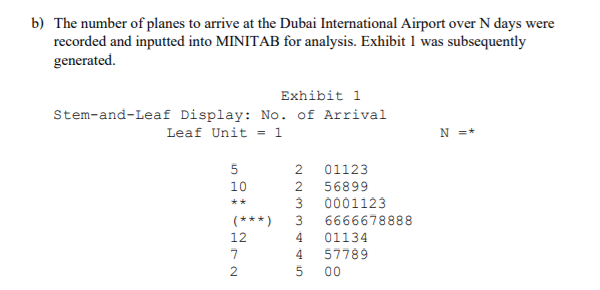
Transcribed Image Text:b) The number of planes to arrive at the Dubai International Airport over N days were
recorded and inputted into MINITAB for analysis. Exhibit 1 was subsequently
generated.
Exhibit 1
Stem-and-Leaf Display: No. of Arrival
Leaf Unit = 1
N =*
5
2 01123
10
2
56899
0001123
3
(***)
**
3
6666678888
12
4
01134
57789
2
00
Expert Solution
This question has been solved!
Explore an expertly crafted, step-by-step solution for a thorough understanding of key concepts.

Step by step
Solved in 4 steps with 3 images

Recommended textbooks for you
Algebra & Trigonometry with Analytic Geometry
Algebra
ISBN:
9781133382119
Author:
Swokowski
Publisher:
Cengage
Algebra & Trigonometry with Analytic Geometry
Algebra
ISBN:
9781133382119
Author:
Swokowski
Publisher:
Cengage