Stem-and-Leaf Plot Camcorder Screen Sizes (in inches) 1 1 6 24 277888888888 3 1111122 3 Key: 1|6=1.6 Print Done >
Stem-and-Leaf Plot Camcorder Screen Sizes (in inches) 1 1 6 24 277888888888 3 1111122 3 Key: 1|6=1.6 Print Done >

Big Ideas Math A Bridge To Success Algebra 1: Student Edition 2015
1st Edition
ISBN:9781680331141
Author:HOUGHTON MIFFLIN HARCOURT
Publisher:HOUGHTON MIFFLIN HARCOURT
Chapter4: Writing Linear Equations
Section4.4: Scatter Plots And Lines Of Fit
Problem 21E

Related questions
Question
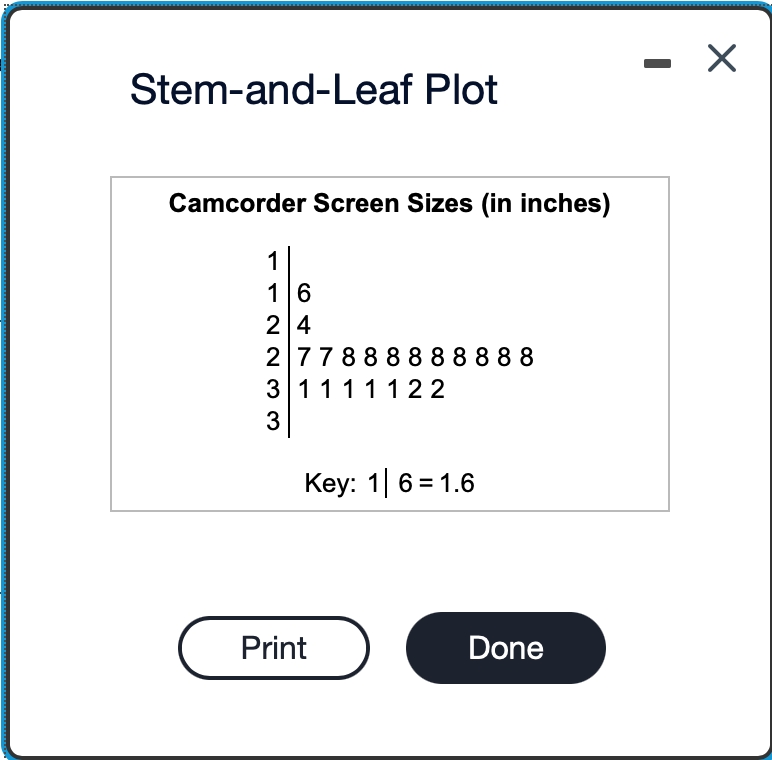
Transcribed Image Text:Stem-and-Leaf Plot
Camcorder Screen Sizes (in inches)
1
1 6
24
2
3 111 1122
3
77888888888
Key: 16 = 1.6
Print
Done
- X
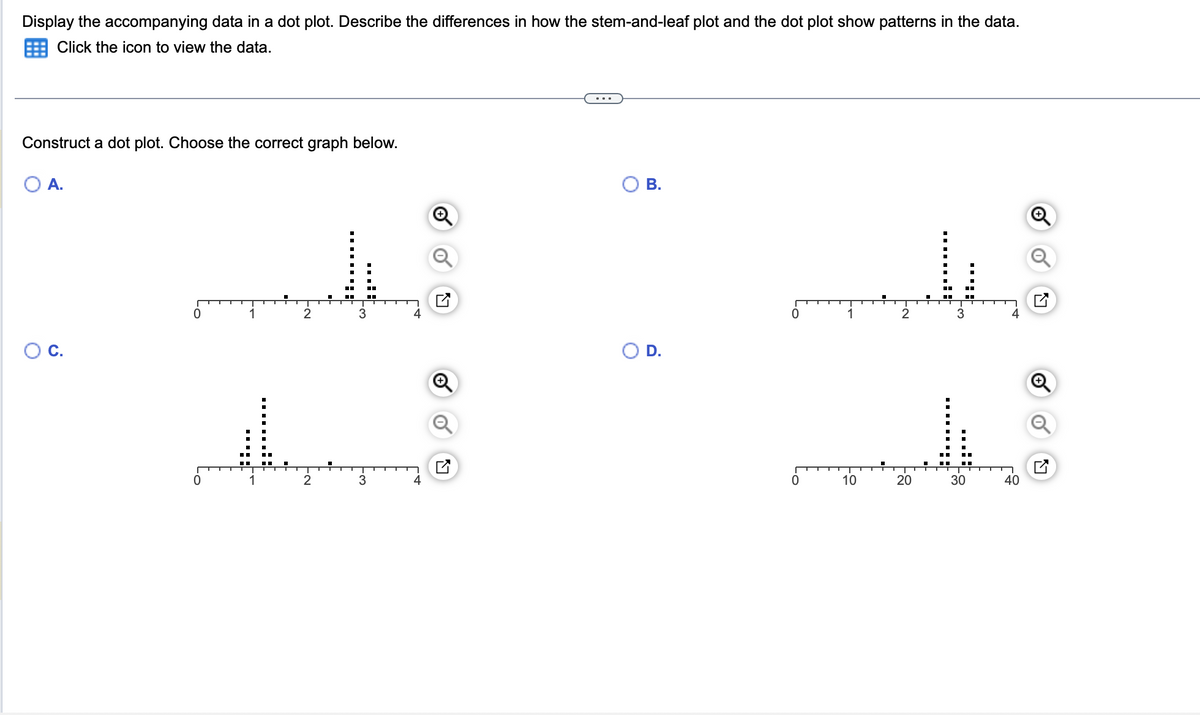
Transcribed Image Text:Display the accompanying data in a dot plot. Describe the differences in how the stem-and-leaf plot and the dot plot show patterns in the data.
Click the icon to view the data.
Construct a dot plot. Choose the correct graph below.
A.
O C.
1
1
2
2
4
■■
■
3
3
N
B.
D.
0
0
1
10
4
2
20
F3₂
30
40
Expert Solution
This question has been solved!
Explore an expertly crafted, step-by-step solution for a thorough understanding of key concepts.

This is a popular solution!

Trending now
This is a popular solution!

Step by step
Solved in 3 steps with 2 images

Follow-up Questions
Read through expert solutions to related follow-up questions below.
Follow-up Question

Transcribed Image Text:Display the accompanying data in a dot plot. Describe the differences in how the stem-and-leaf plot and the dot plot show patterns in the data.
Click the icon to view the data.
2
4
O D.
2
J
10
20
30
0
40
Describe the differences between the stem-and-leaf plot and the dot plot in how they present data.
The stem-and-leaf plot shows that all data values are between 2.7 and 3.2. The dot plot shows that the values 2.7 and 3.2 occur the most often, with occurring
the most frequently.
Solution
Recommended textbooks for you
Big Ideas Math A Bridge To Success Algebra 1: Stu…
Algebra
ISBN:
9781680331141
Author:
HOUGHTON MIFFLIN HARCOURT
Publisher:
Houghton Mifflin Harcourt

Holt Mcdougal Larson Pre-algebra: Student Edition…
Algebra
ISBN:
9780547587776
Author:
HOLT MCDOUGAL
Publisher:
HOLT MCDOUGAL

Glencoe Algebra 1, Student Edition, 9780079039897…
Algebra
ISBN:
9780079039897
Author:
Carter
Publisher:
McGraw Hill
Big Ideas Math A Bridge To Success Algebra 1: Stu…
Algebra
ISBN:
9781680331141
Author:
HOUGHTON MIFFLIN HARCOURT
Publisher:
Houghton Mifflin Harcourt
Holt Mcdougal Larson Pre-algebra: Student Edition…
Algebra
ISBN:
9780547587776
Author:
HOLT MCDOUGAL
Publisher:
HOLT MCDOUGAL
Glencoe Algebra 1, Student Edition, 9780079039897…
Algebra
ISBN:
9780079039897
Author:
Carter
Publisher:
McGraw Hill