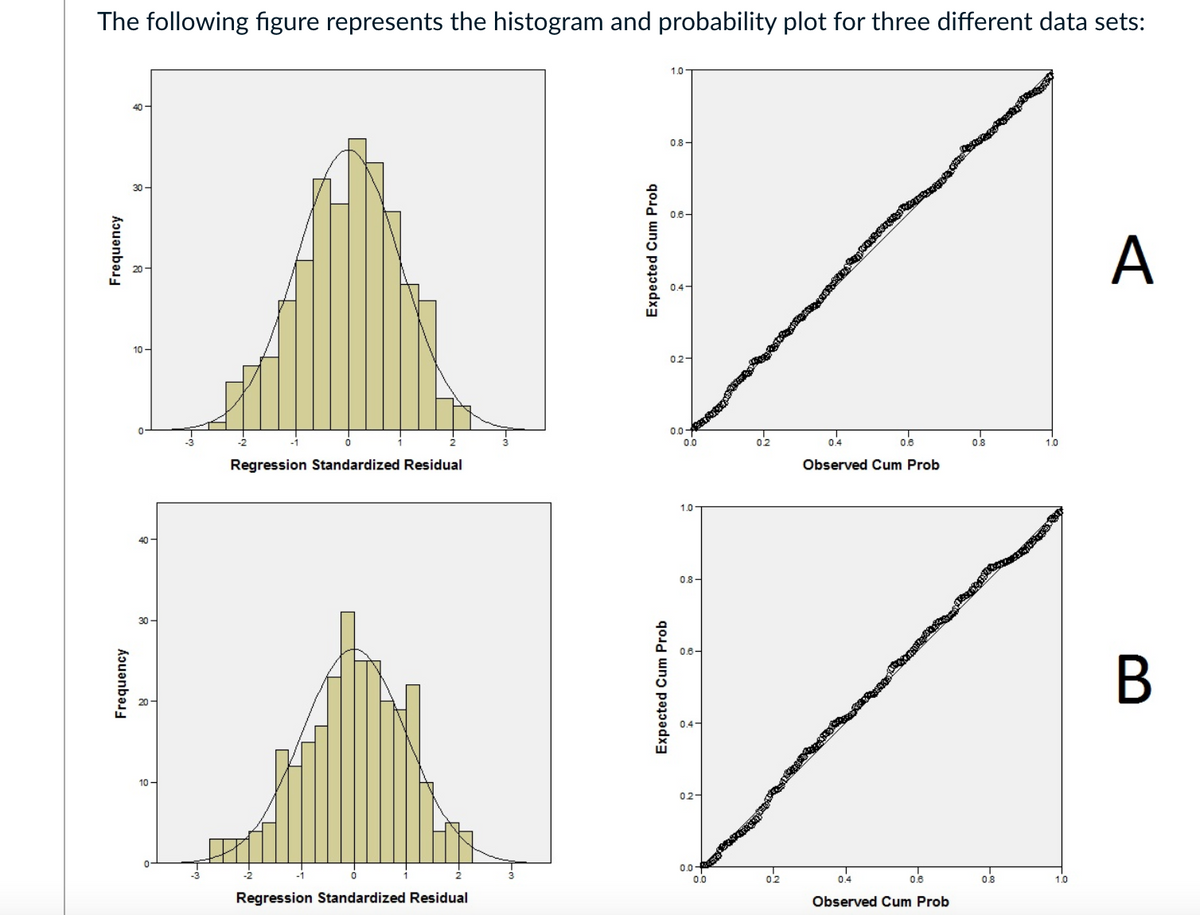
The following figure represents the histogram and probability plot for three different data sets: 1.0 08- A 02- 0- 00 Regression Standardized Residual Observed Cum Prob 1.0 08- B 0.4- 10- 02- 00 02 Regression Standardized Residual Observed Cum Prob Frequency Frequency Expected Cum Prob Expected Cum Prob
The following figure represents the histogram and probability plot for three different data sets: 1.0 08- A 02- 0- 00 Regression Standardized Residual Observed Cum Prob 1.0 08- B 0.4- 10- 02- 00 02 Regression Standardized Residual Observed Cum Prob Frequency Frequency Expected Cum Prob Expected Cum Prob

Glencoe Algebra 1, Student Edition, 9780079039897, 0079039898, 2018
18th Edition
ISBN:9780079039897
Author:Carter
Publisher:Carter
Chapter10: Statistics
Section10.4: Distributions Of Data
Problem 19PFA

Related questions

Question
SEE IMAGES
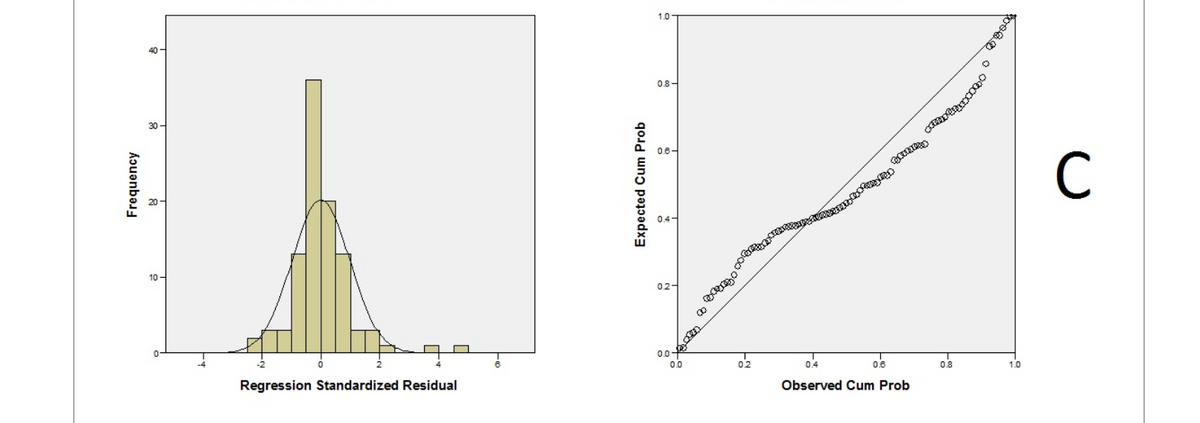
Select the charts (there can be more than one) which represent a violation of the normality assumption. Note: there are no partial marks for this question
Group of answer choices
Figure B
Figure A
Figure C
Transcribed Image Text:The following figure represents the histogram and probability plot for three different data sets:
1.0
40
0.8-
30 -
A
10 -
02-
0.0+
0.0
04
-1
02
0.6
0.8
1.0
Regression Standardized Residual
Observed Cum Prob
1.0-
40-
08-
30 -
0.6-
0.4-
10-
02-
0.0
0.0
02
0.6
08
1.0
Regression Standardized Residual
Observed Cum Prob
Frequency
kɔuənbəs
Expected Cum Prob
Expected Cum Prob
B
Transcribed Image Text:1.0
40 -
0.8-
C
10 -
02-
0.0-
0.0
0.2
0.4
0.8
0.8
1.0
Regression Standardized Residual
Observed Cum Prob
Frequency
Expected Cum Prob
Expert Solution
This question has been solved!
Explore an expertly crafted, step-by-step solution for a thorough understanding of key concepts.

Step by step
Solved in 4 steps

Knowledge Booster


Learn more about
Need a deep-dive on the concept behind this application? Look no further. Learn more about this topic, statistics and related others by exploring similar questions and additional content below.Recommended textbooks for you
Glencoe Algebra 1, Student Edition, 9780079039897…
Algebra
ISBN:
9780079039897
Author:
Carter
Publisher:
McGraw Hill
Glencoe Algebra 1, Student Edition, 9780079039897…
Algebra
ISBN:
9780079039897
Author:
Carter
Publisher:
McGraw Hill