Consider the following data. Group 1 Group 2 Group 3 Men 38 50 71 Women 49 29 Given below is the conditional data distribution in each of the groups given that the person was male. Group 1 Group 2 Group 3 Total 24% 31% 45% 100% Create the conditional data distribution in each of the groups given that the person was female. (Round your answers to the nearest integer.) Group 1 Group 2 Group 3 Total % % % % Is there a difference in the distribution of responses for men and women? O The proportions for all three groups are much higher for men than they are for women. O There are no noticeably large differences in the distribution of responses for men and women. O The proportion for group 1 is much lower for women than it is for men while the proportion for group 2 is much lower for men than it is for women. O The proportions for all three groups are much higher for women than they are for men.
Consider the following data. Group 1 Group 2 Group 3 Men 38 50 71 Women 49 29 Given below is the conditional data distribution in each of the groups given that the person was male. Group 1 Group 2 Group 3 Total 24% 31% 45% 100% Create the conditional data distribution in each of the groups given that the person was female. (Round your answers to the nearest integer.) Group 1 Group 2 Group 3 Total % % % % Is there a difference in the distribution of responses for men and women? O The proportions for all three groups are much higher for men than they are for women. O There are no noticeably large differences in the distribution of responses for men and women. O The proportion for group 1 is much lower for women than it is for men while the proportion for group 2 is much lower for men than it is for women. O The proportions for all three groups are much higher for women than they are for men.

MATLAB: An Introduction with Applications
6th Edition
ISBN:9781119256830
Author:Amos Gilat
Publisher:Amos Gilat
Chapter1: Starting With Matlab
Section: Chapter Questions
Problem 1P

Related questions
Question
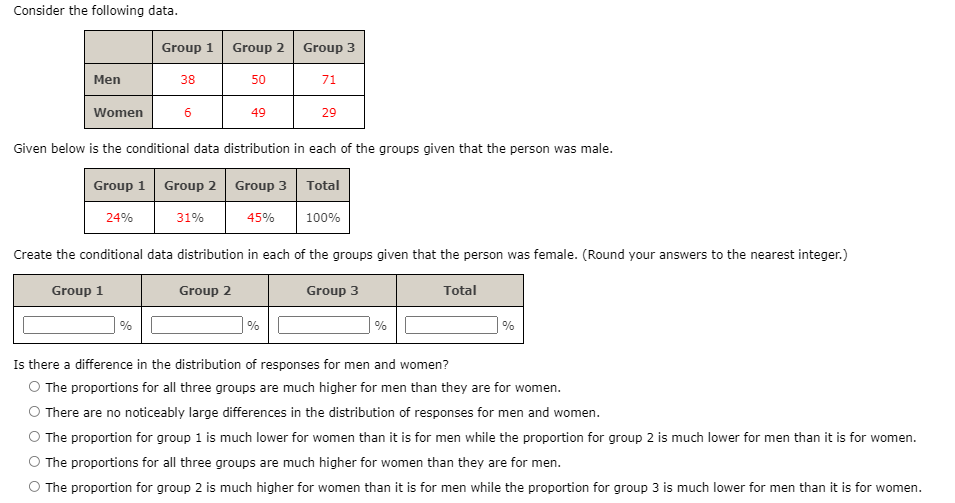
Transcribed Image Text:Consider the following data.
Group 1
Group 2
Group 3
Men
38
50
71
Women
6
49
29
Given below is the conditional data distribution in each of the groups given that the person was male.
Group 1 Group 2
Group 3 Total
24%
31%
45%
100%
Create the conditional data distribution in each of the groups given that the person was female. (Round your answers to the nearest integer.)
Group 1
Group 2
Group 3
Total
%
%
%
%
Is there a difference in the distribution of responses for men and women?
O The proportions for all three groups are much higher for men than they are for women.
O There are no noticeably large differences in the distribution of responses for men and women.
O The proportion for group 1 is much lower for women than it is for men while the proportion for group 2 is much lower for men than it is for women.
The proportions for all three groups are much higher for women than they are for men.
O The proportion for group 2 is much higher for women than it is for men while the proportion for group 3 is much lower for men than it is for women.
Expert Solution
This question has been solved!
Explore an expertly crafted, step-by-step solution for a thorough understanding of key concepts.

This is a popular solution!

Trending now
This is a popular solution!

Step by step
Solved in 2 steps

Recommended textbooks for you
MATLAB: An Introduction with Applications
Statistics
ISBN:
9781119256830
Author:
Amos Gilat
Publisher:
John Wiley & Sons Inc

Probability and Statistics for Engineering and th…
Statistics
ISBN:
9781305251809
Author:
Jay L. Devore
Publisher:
Cengage Learning

Statistics for The Behavioral Sciences (MindTap C…
Statistics
ISBN:
9781305504912
Author:
Frederick J Gravetter, Larry B. Wallnau
Publisher:
Cengage Learning
MATLAB: An Introduction with Applications
Statistics
ISBN:
9781119256830
Author:
Amos Gilat
Publisher:
John Wiley & Sons Inc
Probability and Statistics for Engineering and th…
Statistics
ISBN:
9781305251809
Author:
Jay L. Devore
Publisher:
Cengage Learning
Statistics for The Behavioral Sciences (MindTap C…
Statistics
ISBN:
9781305504912
Author:
Frederick J Gravetter, Larry B. Wallnau
Publisher:
Cengage Learning

Elementary Statistics: Picturing the World (7th E…
Statistics
ISBN:
9780134683416
Author:
Ron Larson, Betsy Farber
Publisher:
PEARSON

The Basic Practice of Statistics
Statistics
ISBN:
9781319042578
Author:
David S. Moore, William I. Notz, Michael A. Fligner
Publisher:
W. H. Freeman

Introduction to the Practice of Statistics
Statistics
ISBN:
9781319013387
Author:
David S. Moore, George P. McCabe, Bruce A. Craig
Publisher:
W. H. Freeman