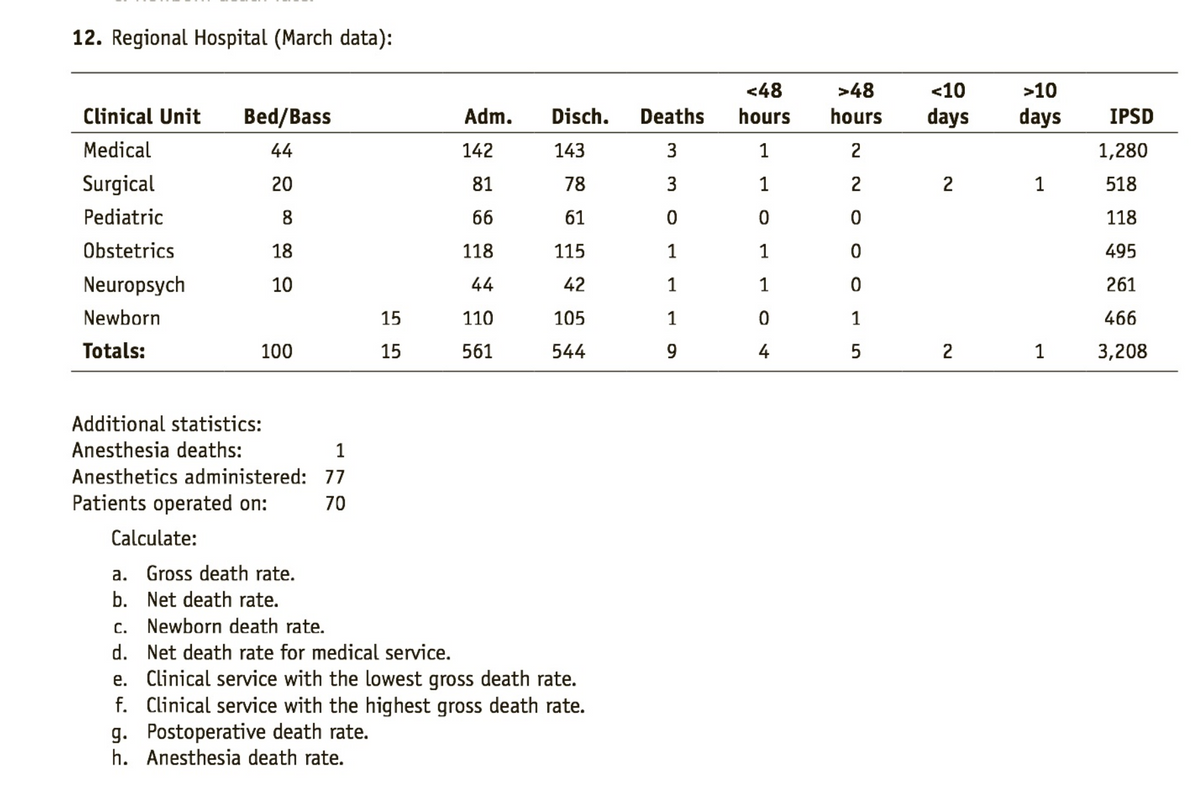
12. Regional Hospital (March data): <48 >48 <10 >10 Clinical Unit Bed/Bass Adm. Disch. Deaths hours hours days days IPSD Medical 44 142 143 3 1 2 1,280 Surgical 20 81 78 3 1 2 2 1 518 Pediatric 66 61 118 Obstetrics 18 118 115 1 1 495 Neuropsych 10 44 42 1 1 261 Newborn 15 110 105 1 1 466 Totals: 100 15 561 544 4 2 1 3,208 Additional statistics: Anesthesia deaths: 1 Anesthetics administered: 77 Patients operated on: 70 Calculate: a. Gross death rate. b. Net death rate. c. Newborn death rate. d. Net death rate for medical service. e. Clinical service with the lowest gross death rate. f. Clinical service with the highest gross death rate. g. Postoperative death rate. h. Anesthesia death rate.
12. Regional Hospital (March data): <48 >48 <10 >10 Clinical Unit Bed/Bass Adm. Disch. Deaths hours hours days days IPSD Medical 44 142 143 3 1 2 1,280 Surgical 20 81 78 3 1 2 2 1 518 Pediatric 66 61 118 Obstetrics 18 118 115 1 1 495 Neuropsych 10 44 42 1 1 261 Newborn 15 110 105 1 1 466 Totals: 100 15 561 544 4 2 1 3,208 Additional statistics: Anesthesia deaths: 1 Anesthetics administered: 77 Patients operated on: 70 Calculate: a. Gross death rate. b. Net death rate. c. Newborn death rate. d. Net death rate for medical service. e. Clinical service with the lowest gross death rate. f. Clinical service with the highest gross death rate. g. Postoperative death rate. h. Anesthesia death rate.

Functions and Change: A Modeling Approach to College Algebra (MindTap Course List)
6th Edition
ISBN:9781337111348
Author:Bruce Crauder, Benny Evans, Alan Noell
Publisher:Bruce Crauder, Benny Evans, Alan Noell
Chapter5: A Survey Of Other Common Functions
Section5.3: Modeling Data With Power Functions
Problem 6E: Urban Travel Times Population of cities and driving times are related, as shown in the accompanying...

Related questions
Question
Hello, this is one of my questions for my assignment. My other questions are similar, I would love a step by step example.
Transcribed Image Text:12. Regional Hospital (March data):
<48
>48
<10
>10
Clinical Unit
Bed/Bass
Adm.
Disch.
Deaths
hours
hours
days
days
IPSD
Medical
44
142
143
3
1
2
1,280
Surgical
20
81
78
3
1
2
2
1
518
Pediatric
8
66
61
118
Obstetrics
18
118
115
1
1
495
Neuropsych
10
44
42
1
1
261
Newborn
15
110
105
1
1
466
Totals:
100
15
561
544
9
4
5
2
1
3,208
Additional statistics:
Anesthesia deaths:
1
Anesthetics administered: 77
Patients operated on:
70
Calculate:
a. Gross death rate.
b. Net death rate.
c. Newborn death rate.
d. Net death rate for medical service.
e. Clinical service with the lowest gross death rate.
f. Clinical service with the highest gross death rate.
g. Postoperative death rate.
h. Anesthesia death rate.
Expert Solution
This question has been solved!
Explore an expertly crafted, step-by-step solution for a thorough understanding of key concepts.

This is a popular solution!

Trending now
This is a popular solution!

Step by step
Solved in 4 steps with 3 images

Knowledge Booster


Learn more about
Need a deep-dive on the concept behind this application? Look no further. Learn more about this topic, algebra and related others by exploring similar questions and additional content below.Recommended textbooks for you
Functions and Change: A Modeling Approach to Coll…
Algebra
ISBN:
9781337111348
Author:
Bruce Crauder, Benny Evans, Alan Noell
Publisher:
Cengage Learning
Functions and Change: A Modeling Approach to Coll…
Algebra
ISBN:
9781337111348
Author:
Bruce Crauder, Benny Evans, Alan Noell
Publisher:
Cengage Learning