Consider the following sample data on two random variables X and Y. Identify the regre fits the given data. - X Y 275 168 6.8 1.1 3.3 3.9 142 188 4.9 241 7.7 5.0 295 200 266 5.9 4.8 215 3.1 125 4.2 197
Consider the following sample data on two random variables X and Y. Identify the regre fits the given data. - X Y 275 168 6.8 1.1 3.3 3.9 142 188 4.9 241 7.7 5.0 295 200 266 5.9 4.8 215 3.1 125 4.2 197

Glencoe Algebra 1, Student Edition, 9780079039897, 0079039898, 2018
18th Edition
ISBN:9780079039897
Author:Carter
Publisher:Carter
Chapter10: Statistics
Section10.3: Measures Of Spread
Problem 26PFA

Related questions
Question
Number 2 only
Transcribed Image Text:. CONFIDENCE INTERVAL & LINEAR REGRESSION (
Soive the following problems. Show complete solutions to earn full merits.
in ab-
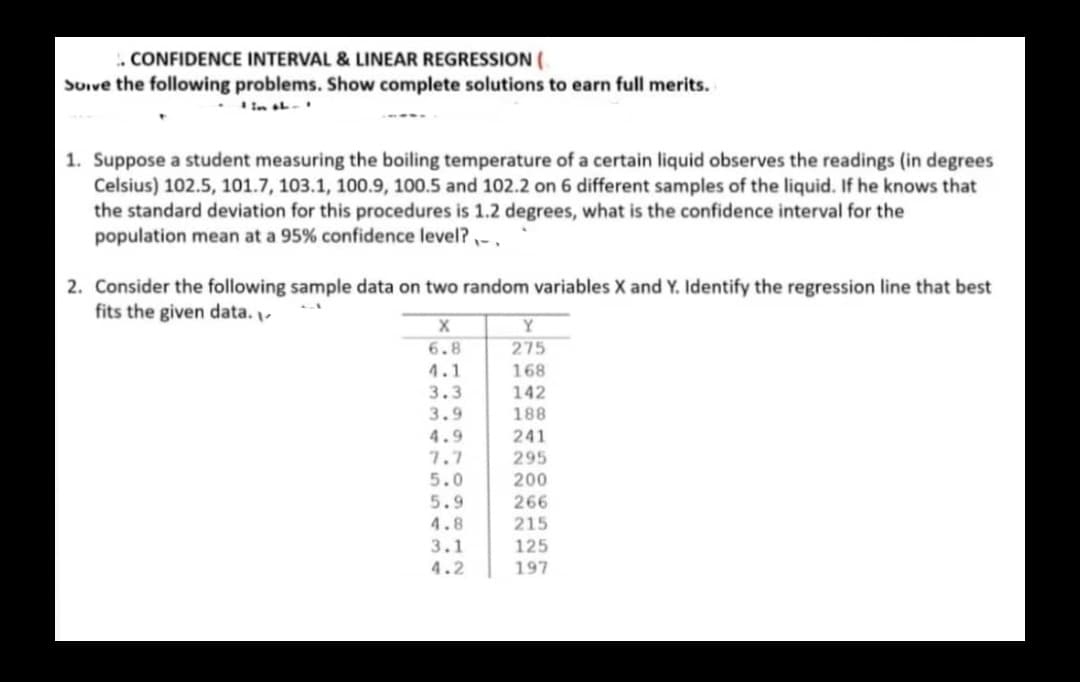
1. Suppose a student measuring the boiling temperature of a certain liquid observes the readings (in degrees
Celsius) 102.5, 101.7, 103.1, 100.9, 100.5 and 102.2 on 6 different samples of the liquid. If he knows that
the standard deviation for this procedures is 1.2 degrees, what is the confidence interval for the
population mean at a 95% confidence level? ,-,
2. Consider the following sample data on two random variables X and Y. Identify the regression line that best
fits the given data.
Y
6.8
275
4.1
3.3
168
142
3.9
188
4.9
241
7.7
295
5.0
200
5.9
266
4.8
215
3.1
125
4.2
197
Expert Solution
This question has been solved!
Explore an expertly crafted, step-by-step solution for a thorough understanding of key concepts.

Step by step
Solved in 2 steps with 2 images

Recommended textbooks for you
Glencoe Algebra 1, Student Edition, 9780079039897…
Algebra
ISBN:
9780079039897
Author:
Carter
Publisher:
McGraw Hill
Glencoe Algebra 1, Student Edition, 9780079039897…
Algebra
ISBN:
9780079039897
Author:
Carter
Publisher:
McGraw Hill