(a) What is the level of significance? State the null and alternate hypotheses. О Но: р %3D 0.24;B H,: р # 0.24 O Ho: p # 0.24; H,: p = 0.24 Hо: р 3D 0.24;B н,: р <0.24 о Но: р 3D 0.24;B H,: р> 0.24 (b) What sampling distribution will you use? The Student's t, since np > 5 and ng > 5. O The Student's t, since np < 5 and nq < 5. O The standard normal, since np < 5 and ng < 5. O The standard normal, since np > 5 and nq > 5. What is the value of the sample test statistic? (Round your answer to two decimal places. (c) Find the P-value of the test statistic. (Round your answer to four decimal places.)
(a) What is the level of significance? State the null and alternate hypotheses. О Но: р %3D 0.24;B H,: р # 0.24 O Ho: p # 0.24; H,: p = 0.24 Hо: р 3D 0.24;B н,: р <0.24 о Но: р 3D 0.24;B H,: р> 0.24 (b) What sampling distribution will you use? The Student's t, since np > 5 and ng > 5. O The Student's t, since np < 5 and nq < 5. O The standard normal, since np < 5 and ng < 5. O The standard normal, since np > 5 and nq > 5. What is the value of the sample test statistic? (Round your answer to two decimal places. (c) Find the P-value of the test statistic. (Round your answer to four decimal places.)

Holt Mcdougal Larson Pre-algebra: Student Edition 2012
1st Edition
ISBN:9780547587776
Author:HOLT MCDOUGAL
Publisher:HOLT MCDOUGAL
Chapter11: Data Analysis And Probability
Section11.4: Collecting Data
Problem 2E

Related questions

Topic Video
Question
What is your favorite color? A large survey of countries, including the United States, China, Russia, France, Turkey, Kenya, and others, indicated that most people prefer the color blue. In fact, about 24% of the population claim blue as their favorite color.† Suppose a random sample of n = 53 college students were surveyed and r = 11 of them said that blue is their favorite color. Does this information imply that the color preference of all college students is different (either way) from that of the general population? Use ? = 0.05.
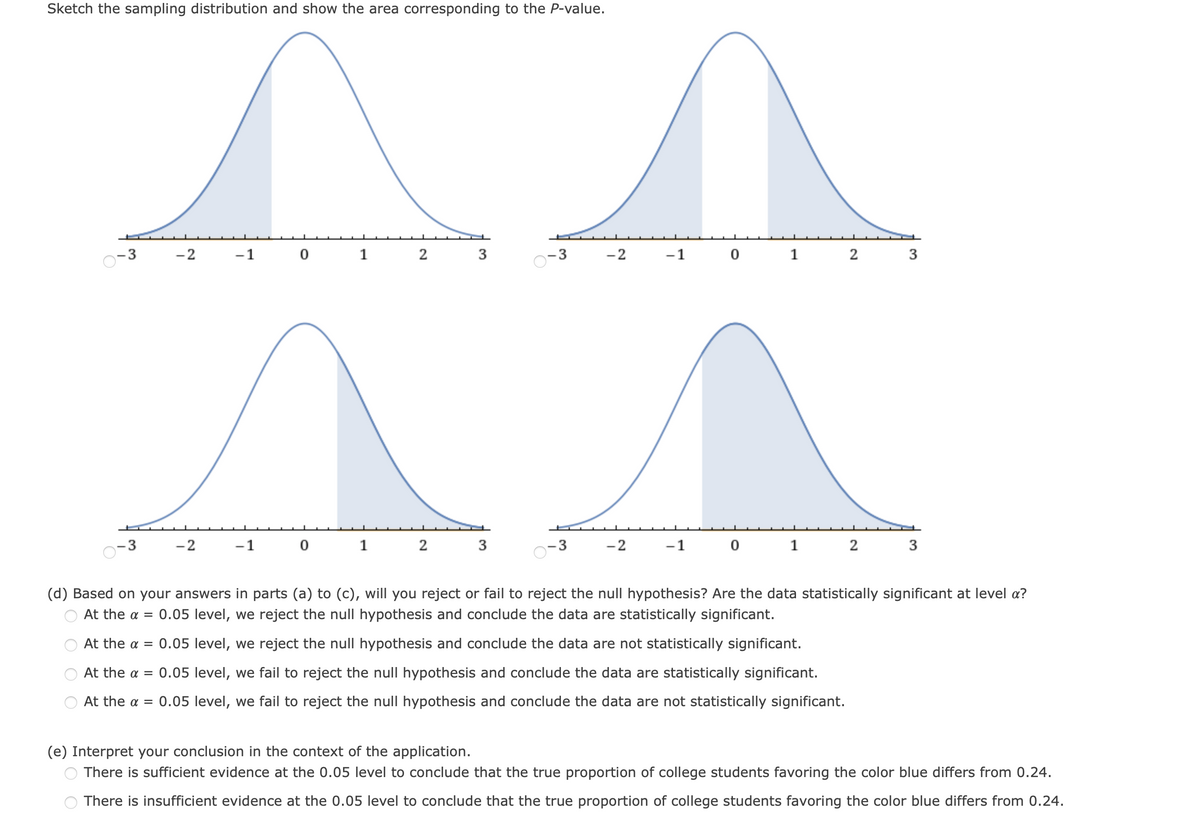
Transcribed Image Text:Sketch the sampling distribution and show the area corresponding to the P-value.
3
-2
-1
1 2
3
-2
-1 0 1 2
3
-2
-1
1
-2
-1 0
1
(d) Based on your answers in parts (a) to (c), will you reject or fail to reject the null hypothesis? Are the data statistically significant at level a?
At the a =
0.05 level, we reject the null hypothesis and conclude the data are statistically significant.
At the a = 0.05 level, we reject the null hypothesis and conclude the data are not statistically significant.
At the a = 0.05 level, we fail to reject the null hypothesis and conclude the data are statistically significant.
At the a = 0.05 level, we fail to reject the null hypothesis and conclude the data are not statistically significant.
(e) Interpret your conclusion in the context of the application.
There is sufficient evidence at the 0.05 level to conclude that the true proportion of college students favoring the color blue differs from 0.24.
There is insufficient evidence at the 0.05 level to conclude that the true proportion of college students favoring the color blue differs from 0.24.
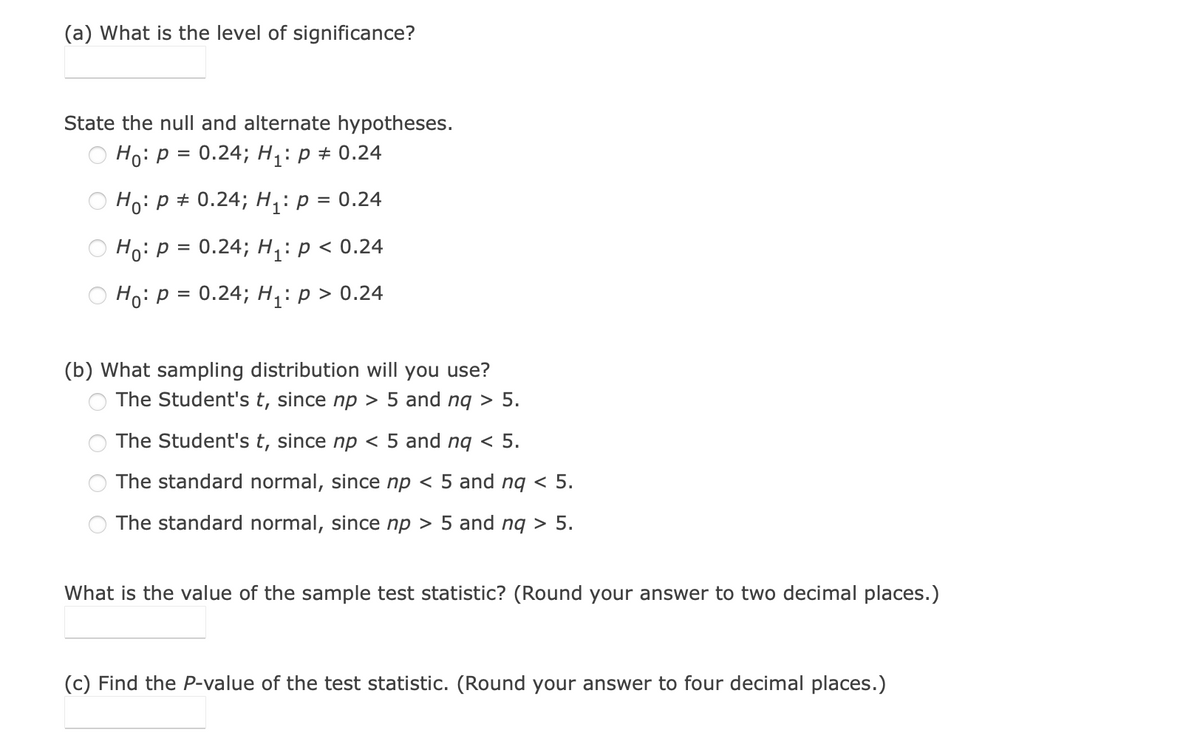
Transcribed Image Text:(a) What is the level of significance?
State the null and alternate hypotheses.
Ho: p = 0.24; H,: p + 0.24
Ho: p + 0.24; H,: p = 0.24
Ho: p = 0.24; H;: p < 0.24
Но: Р 3D 0.24; H;: р> 0.24
(b) What sampling distribution will you use?
The Student's t, since np > 5 and ng > 5.
The Student's t, since np < 5 and nq < 5.
The standard normal, since np < 5 and nq < 5.
The standard normal, since np > 5 and nq > 5.
What is the value of the sample test statistic? (Round your answer to two decimal places.)
(c) Find the P-value of the test statistic. (Round your answer to four decimal places.)
Expert Solution
This question has been solved!
Explore an expertly crafted, step-by-step solution for a thorough understanding of key concepts.

Step by step
Solved in 3 steps with 4 images

Knowledge Booster


Learn more about
Need a deep-dive on the concept behind this application? Look no further. Learn more about this topic, statistics and related others by exploring similar questions and additional content below.Recommended textbooks for you
Holt Mcdougal Larson Pre-algebra: Student Edition…
Algebra
ISBN:
9780547587776
Author:
HOLT MCDOUGAL
Publisher:
HOLT MCDOUGAL

College Algebra (MindTap Course List)
Algebra
ISBN:
9781305652231
Author:
R. David Gustafson, Jeff Hughes
Publisher:
Cengage Learning
Holt Mcdougal Larson Pre-algebra: Student Edition…
Algebra
ISBN:
9780547587776
Author:
HOLT MCDOUGAL
Publisher:
HOLT MCDOUGAL
College Algebra (MindTap Course List)
Algebra
ISBN:
9781305652231
Author:
R. David Gustafson, Jeff Hughes
Publisher:
Cengage Learning