Consider the following time series: Quarter Year 1 Year 2 Year 3 80 74 65 69 61 51 48 50 43 68 71 82 a. Construct a time-series plot. What type of pattern exists in the data? Is there an indication of a seasonal pattern? b. Use multiple linear regression model with dummy variables as follows to develop an equation to account for seasonal effects in the data. Qtrl = 1 if quarter 1,0 else; Qtr2 = 1 if quarter 2,0 else; Qtr3 = 1 if quarter 3,0 else. c. Compute the quarterly forecasts for next year.
Consider the following time series: Quarter Year 1 Year 2 Year 3 80 74 65 69 61 51 48 50 43 68 71 82 a. Construct a time-series plot. What type of pattern exists in the data? Is there an indication of a seasonal pattern? b. Use multiple linear regression model with dummy variables as follows to develop an equation to account for seasonal effects in the data. Qtrl = 1 if quarter 1,0 else; Qtr2 = 1 if quarter 2,0 else; Qtr3 = 1 if quarter 3,0 else. c. Compute the quarterly forecasts for next year.

Functions and Change: A Modeling Approach to College Algebra (MindTap Course List)
6th Edition
ISBN:9781337111348
Author:Bruce Crauder, Benny Evans, Alan Noell
Publisher:Bruce Crauder, Benny Evans, Alan Noell
Chapter5: A Survey Of Other Common Functions
Section5.6: Higher-degree Polynomials And Rational Functions
Problem 1TU: The following fictitious table shows kryptonite price, in dollar per gram, t years after 2006. t=...

Related questions
Question
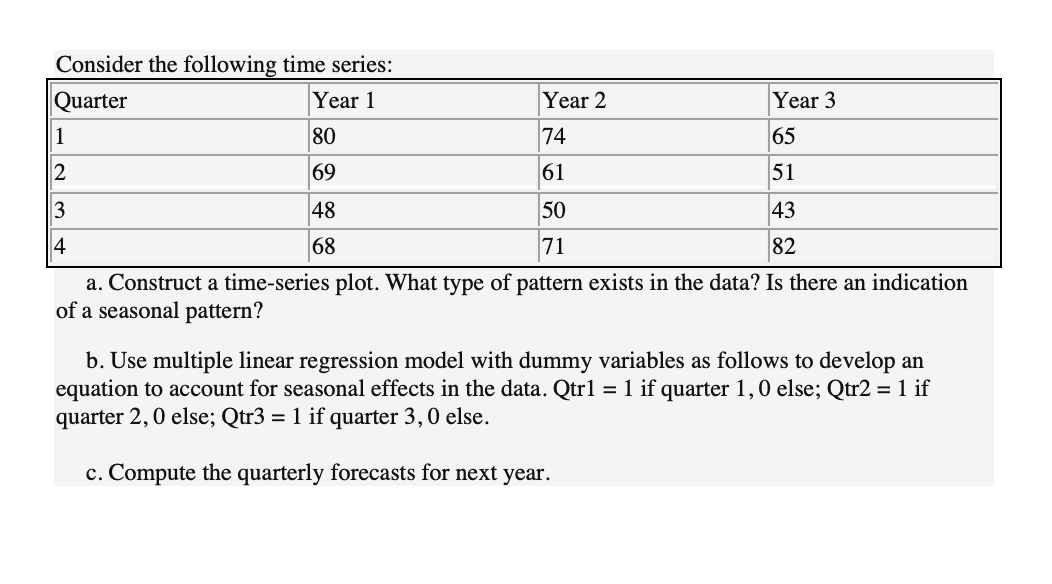
Transcribed Image Text:Consider the following time series:
Quarter
Year 1
Year 2
Year 3
80
74
65
69
61
51
48
50
43
68
71
82
a. Construct a time-series plot. What type of pattern exists in the data? Is there an indication
of a seasonal pattern?
b. Use multiple linear regression model with dummy variables as follows to develop an
equation to account for seasonal effects in the data. Qtrl = 1 if quarter 1,0 else; Qtr2 = 1 if
quarter 2,0 else; Qtr3 = 1 if quarter 3,0 else.
c. Compute the quarterly forecasts for next year.
Expert Solution
This question has been solved!
Explore an expertly crafted, step-by-step solution for a thorough understanding of key concepts.

This is a popular solution!

Trending now
This is a popular solution!

Step by step
Solved in 3 steps with 4 images

Recommended textbooks for you
Functions and Change: A Modeling Approach to Coll…
Algebra
ISBN:
9781337111348
Author:
Bruce Crauder, Benny Evans, Alan Noell
Publisher:
Cengage Learning

College Algebra
Algebra
ISBN:
9781305115545
Author:
James Stewart, Lothar Redlin, Saleem Watson
Publisher:
Cengage Learning

Glencoe Algebra 1, Student Edition, 9780079039897…
Algebra
ISBN:
9780079039897
Author:
Carter
Publisher:
McGraw Hill
Functions and Change: A Modeling Approach to Coll…
Algebra
ISBN:
9781337111348
Author:
Bruce Crauder, Benny Evans, Alan Noell
Publisher:
Cengage Learning
College Algebra
Algebra
ISBN:
9781305115545
Author:
James Stewart, Lothar Redlin, Saleem Watson
Publisher:
Cengage Learning
Glencoe Algebra 1, Student Edition, 9780079039897…
Algebra
ISBN:
9780079039897
Author:
Carter
Publisher:
McGraw Hill