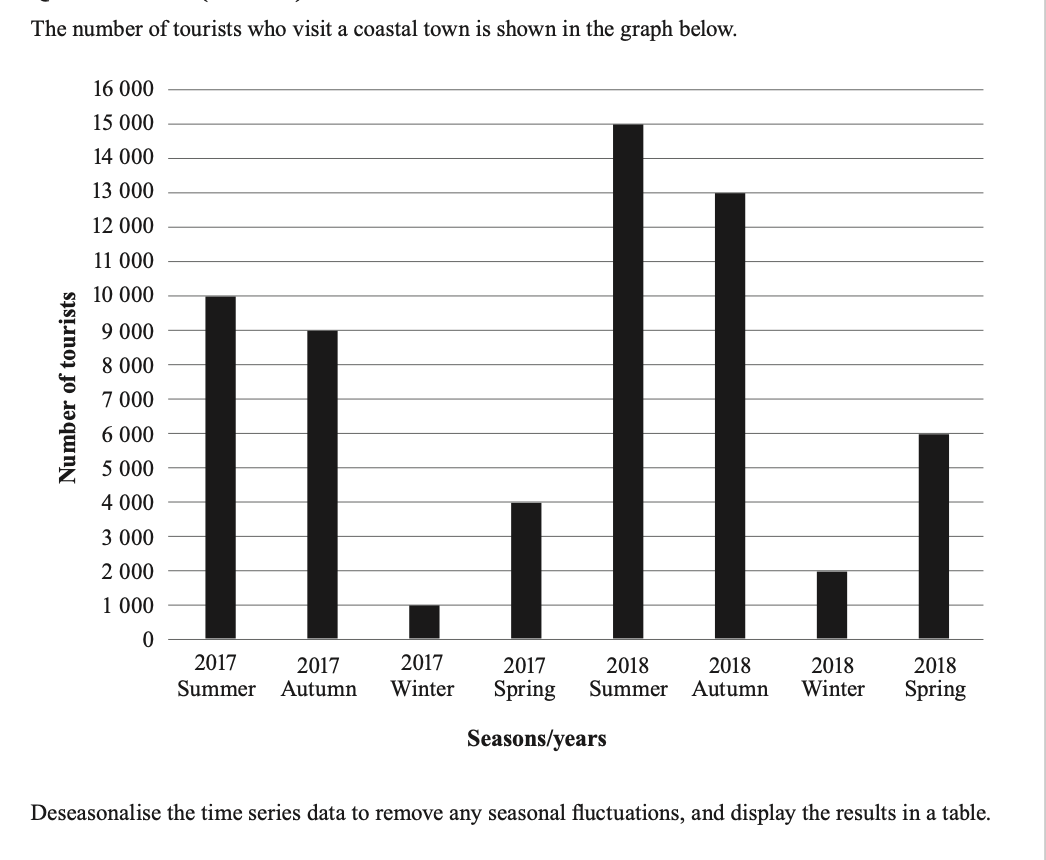
The number of tourists who visit a coastal town is shown in the graph below. Number of tourists 16 000 15 000 14 000 13 000 12 000 11 000 10 000 9 000 8 000 7 000 6 000 5 000 4 000 3 000 2 000 1 000 0 2017 2017 2017 Summer Autumn Winter 2017 2018 2018 2018 Spring Summer Autumn Winter Seasons/years 2018 Spring Deseasonalise the time series data to remove any seasonal fluctuations, and display the results in a table.


Q: Q4. Suppose that the daily miles driven by a trucking company is normally distributed with a mean of…
A:
Q: n a study, the data you collect is the average weight of newborn babies in ounces. What is the…
A: The objective is to identify the scale of measurement used for average weight of newborn babies in…
Q: What is the effective number exposed to risk of dying in the 13- to 24-month interval? Use the…
A: Given the table of survival of patients with metastatic cancer Z diagnosis.
Q: On their first date, Kelly asks Mike to guess the date of her birth, not including the year.…
A: Given that On their first date. Kelly asks Mike to guess the date of her birth, not including the…
Q: is the relations
A: Variables in the sample and population Sample: The process of selecting a sample from a population…
Q: The probability that data are entered incorrectly into a field in a database is 0.005. A data entry…
A: Hint: Uniform distribution has equal probability all over the given interval. Obtain the…
Q: K A standard deck of cards contains 52 cards. One card is selected from the deck. (a) Compute the…
A:
Q: A normal distribution has a mean of 136 and a standard deviation of 10. Find the z-score for a data…
A: Given information- Population mean, µ = 136 Population standard deviation, σ = 10 We have to find…
Q: Probability is the estimation of the chances of a certain event to occur, it is the branch of…
A: There are total n = 47 cards.
Q: Age at Which 150 Women in New York City Married for the First Time CISAS Lynnts Class Boundaries…
A: Given the age at which 150 women in New York City Married for the First time.
Q: Sarah is conducting a research only study in which one group of participants consume one cup of…
A: The study is about assessing attention levels of these participants.
Q: The creator of a new online multiplayer survival game has been tracking the monthly downloads of the…
A: Given data: Month Downloads Month Downloads (previous year) (thousands)…
Q: Suppose a variable X has sample mean 200 and standard deviation 10 and the variable Y has sample…
A: Given For X ( mean = 200 , SD= 10) Y( mean=4000, SD=100) We have to calculate predicted value of Y…
Q: Data was collected for 40 randomly selected trees growing in the median strip of a busy freeway. The…
A: Determine the minimum possible tree height for the given histogram. The minimum possible tree…
Q: A new lecturer has been hired to teach an undergraduate course in psychological research methods.…
A: The following information has been given: x¯1=75 x¯2=79s1=5…
Q: 1. According to the data in Model 1, how many females fall within the range 146-155 cm tall? 2.…
A: Since you have posted a question with multiple subparts, we will solve first three subparts for you.…
Q: An insurance company crashed four cars of the same model at 5 miles per hour. The costs of repair…
A:
Q: For the data points in question number 5: What is the value for r2 for the best fit curve?
A: Given the scatter diagram containing 8 data points. x y -5.5 -8 -4.9 -5.3 -3.7 -3.2 -2…
Q: Suppose that P(A) = 0.46, P(C | A) = = (Hint: Draw a tree diagram first) 0.0065, and P(C"' | A') =…
A: Tree diagram are like tree like structure that used to make decision about the problem. It has…
Q: he highway mileage (mpg) for a sample of 8 different models of a car company can be found below.…
A: The given sample is 30, 35, 22, 19, 29, 35, 27, 26.
Q: Does amount of caffeine affect memory? This study was conducted using 30 participants who report…
A: Given situation: Claim: Does amount of caffeine affect memory?. There are three caffeine conditions:…
Q: Based on a recent study in a manufacturing company, 40% of employees older than 30 years own a car…
A: It is given that, 40% of employees older than 30 years own a car and a house.
Q: 2. The following data shows the ice cream consumption. The ice cream consumption in in pints per…
A: The given data is Consumption Price 0.386 1.35 0.474 1.5 0.393 1.39 0.425 1.49 0.406…
Q: K By rewriting the formula for the Multiplication Rule, you can write a formula for finding…
A: given data,conditional probability of event B occuring , given event A has occuring isp(BA) = p(A…
Q: media. 2006 income of people at least 25 years old who had a bachelors degree but no higher degree…
A: here we have to find which number is the median and which number is mean.
Q: Task: 1. Fill up the table for:
A: Note: Hi there! As per the guidelines, we are solving first three subparts for you. Kindly repost…
Q: Assume that trees are subjected to different levels of carbon dioxide atmosphere with 4% of the…
A:
Q: The Big Mac index is a way of measuring Purchasing Power Parity (PPP) between different countries.…
A: Data is given for price and countries We have to calculate mean and standard deviation We have to…
Q: K A stem-and-leaf plot for the number of touchdowns scored by all Division 1A football teams is…
A: Given that : A stem and leaf plot for the number of touchdowns. To find the required probabilities.
Q: a. Determine two-sigma control limits using the above data. (Round your intermediate calculations to…
A: Given: Day No. of complaints 1 4 2 11 3 15 4 8 5 9 6 6 7 5 8 14 9 14 10 7…
Q: find k? |X=xi P(X=xi) 1 4k 2 k 3 2k 4 3k
A: It is given that the probability distribution of random variable X with values 1, 2, 3 and 4.
Q: An HR manager wants to know if there is a difference between sexes (males and females) on number of…
A: The objective is to identify the scale of measurement of the dependent variable in the given…
Q: Fill in the blank. Events that are Events that are cannot occur at the same time. unusual cannot…
A: It is given that when the events that are cannot occur at the same time.
Q: What is the correct range for probability values? Select one. Question 1 options: un C C Between-1…
A: Hello Thank you for the question. According to our honor code can answer only one question at a…
Q: 11. If X is a random variable with moment generating function M (1) = 5(4+ e')* Find P(X= 0) = a.…
A: Let X be the random variable with moment generating function M(t) = 5-4(4+et)4 Then, We will find…
Q: Suppose that at the beginning of Year 1 you invested $10,000 in the Stivers mutual fund and $5,000…
A: Given data: Year Stivers Trippi 1 $10,900 $5,700 2 $11,600 $6,400 3 $12,900 $6,900 4…
Q: Identify the lower class limits. (Type integers or decimals. Do not round. Use ascending…
A: Given that Age (yr) when award was won Frequency 25 - 34 29 35 - 44 34 45 - 54 15 55 -…
Q: A truth serum has the property that 93% of the guilty suspects are properly judged while, of course,…
A: Given Information: 93% of the guilty suspects are properly judged 7% of the guilty suspects are…
Q: 1/For the below frequency distribution table calculate all the below reequipments. Class Frequency…
A: Given information: The given frequency distribution table: Class Frequency 2-4 7 6-8 8…
Q: A time series {yt} follows an MA(2) model: Yt = 2 + Ut +0.54t-1 + 0.4ut-2. Assume that ut is a white…
A: Here it is given that a time series yt follows an MA(2) model :…
Q: The y-interept bo of a least-squares regression line has a useful interpretation only if the…
A: Given: The y-intercept b0 of a least-squares regression line has a useful interpretation only if the…
Q: a. The type of graph displayed is called a b. % of the countries have average Big Mac price less…
A: Given that
Q: The table below gives the list price and the number of bids received for five randomly selected…
A: Suppose x defines the price and y defines the number of birds.
Q: Student Perpectual Bempah Megan Brooks Jeff Honeycutt Clarice Jefferson Crystal Kurtenbach Janette…
A: It is given that there are three simple random samples of size 3. Sample 1: {Janette, Kevin,…
Q: Assume that there is a 11% rate of disk drive failure in a year. a. If all your computer data is…
A: Given Information: Probability of failure of the disk drive in a year (pf)=0.11
Q: Fillmore is committed to accepting the contract that provides him with the highest net present value…
A: For a given set of cashflows with same time period, an investor would be indifferent between the two…
Q: pls answer b with some explanation tq
A: Anova explain the mean significance between the three or more groups. It use F test to make…
Q: What does it mean to say that two variables are positively associated? Negatively associated?
A: Association: The association of how two varaibles are connected with each other. It decides how one…
Q: 32 TABLE 1.3 Per capita total expenditure on health (international dollars) Dollars Country Country…
A: Introduction: It is required to make a stem plot, describe the shape, center, and variability of the…
Q: Q4. Suppose that the daily miles driven by a trucking company is normally distributed with a mean of…
A: Mean(µ) = 330Standard deviations (σ) = 115X ~ N (µ, σ )= N(330, 115)

Step by step
Solved in 2 steps with 5 images

- Table 6 shows the year and the number ofpeople unemployed in a particular city for several years. Determine whether the trend appears linear. If so, and assuming the trend continues, in what year will the number of unemployed reach 5 people?The elevation of a lake surface (feet above sea level) varies according to the annual flow of a river that feeds it. A geological survey provided the following data from equally spaced intervals of time over a 15 year period. Time Period Elevation 1 4817 2 4819 3 4824 4 4822 5 4826 6 4831 7 4836 8 4837 9 4839 10 4837 11 4832 12 4827 13 4823 14 4818 15 4817 Make a time-series graph displaying the data.The folloiwing table shows data for U.S. movie theater admissions (per week). Display the data as a time-series graph and write a short paragraph explaining any noticeable trends or patterns. Year Admissions Year Admissions 1945 79.0 1985 20.30 1955 39.9 1995 23.3 1965 19.8 2005 26.5 1975 19.9 2015 25.4
- The table below contains the average price paid for a new home in a certain area from 2000 to 2010. a. Construct a time-series plot of new home prices. b. What pattern, if any, is present in the data? Year Average_Price_($_thousands)2000 351.12001 330.52002 310.52003 296.72004 229.72005 182.32006 154.52007 156.32008 154.72009 154.52010 154.5corporate triple-a bond interest rates for 12 consecutive months follow.9.5 9.3 9.4 9.6 9.8 9.7 9.8 10.5 9.9 9.7 9.6 9.6a. construct a time series plot. What type of pattern exists in the data?b. develop three-month and four-month moving averages for this time series. does thethree-month or four-month moving average provide more accurate forecasts basedon MSe? explain.A statistical program is recommended. The quarterly sales data (number of copies sold) for a college textbook over the past three years follow. Quarter Year 1 Year 2 Year 3 1 1,690 1,800 1,860 2 950 910 1,110 3 2,625 2,910 2,940 4 2,510 2,370 2,615 (a) Construct a time series plot. What type of pattern exists in the data? There appears be a downward linear trend but no seasonal pattern in the data.There appears to be a seasonal pattern in the data and perhaps a moderate upward linear trend. There appears be an upward linear trend but no seasonal pattern in the data.There appears to be a seasonal pattern in the data and perhaps a moderate downward linear trend. (b) Use a regression model with dummy variables as follows to develop an equation to account for seasonal effects in the data. (Round your numerical values to the nearest integer.) Qrt1 = 1 if quarter 1, 0 otherwise; Qrt2 = 1 if quarter 2, 0 otherwise; Qrt3 = 1 if quarter 3, 0 otherwise t =…
- A statistical program is recommended. The quarterly sales data (number of copies sold) for a college textbook over the past three years follow. Quarter Year 1 Year 2 Year 3 1 1,690 1,800 1,850 2 940 900 1,100 3 2,625 2,900 2,930 4 2,500 2,360 2,615 (a) Construct a time series plot. What type of pattern exists in the data? There appears be an upward linear trend but no seasonal pattern in the data. There appears be a downward linear trend but no seasonal pattern in the data. There appears to be a seasonal pattern in the data and perhaps a moderate downward linear trend. There appears to be a seasonal pattern in the data and perhaps a moderate upward linear trend. (b) Use a regression model with dummy variables as follows to develop an equation to account for seasonal effects in the data. (Round your numerical values to the nearest integer.) Qrt1 = 1 if quarter 1, 0 otherwise; Qrt2 = 1 if quarter 2, 0 otherwise; Qrt3 = 1 if quarter 3, 0 otherwise t = { } (c) Using…corporate triple-a bond interest rates for 12 consecutive months follow.9.5 9.3 9.4 9.6 9.8 9.7 9.8 10.5 9.9 9.7 9.6 9.6a. construct a time series plot. What type of pattern exists in the data?b. develop three-month and four-month moving averages for this time series. does thethree-month or four-month moving average provide more accurate forecasts basedon MSe? explain.c. What is the moving average forecast for the next month?#4) Commuter ridership in Athens, Greece, during the summer months is believed to be heavily tied to the number of tourists visiting the city. During the past 12 years, the data are given in the following table. Year Number of Tourists (millions) Ridership (hundreds of thousands) 1 6 11 2 11 16 3 8 16 4 10 14 5 19 28 6 18 26 7 16 21 8 20 25 9 24 45 10 18 28 11 11 18 12 19 35 a) Create a time series plot for the ridership. b) Using linear regression to see if using the year is a good predictor for the ridership. What is the regression equation? How accurate is the model? c) Using linear regression to see if using the number of tourists is a good predictor for the ridership. What is the regression equation? How accurate is the model? d) Which linear regression equation is better? What is the expected ridership if 10 million tourists visit the city next year? e) Excel File
- The Seneca Children’s Fund (SCC) is a local charity that runs a summer camp for disadvantagedchildren. The fund’s board of directors has been working very hard over recentyears to decrease the amount of overhead expenses, a major factor in how charities arerated by independent agencies. The following data show the percentage of the money SCChas raised that was spent on administrative and fund-raising expenses over the last sevenyears. a. Construct a time series plot. What type of pattern exists in the data?b. Use simple linear regression analysis to find the parameters for the line that minimizesMSE for this time series.c. Forecast the percentage of administrative expenses for year 8.d. If SCC can maintain its current trend in reducing administrative expenses, how longwill it take SCC to achieve a level of 5 percent or less?In retail, a store manager uses time series models to understand shopping trends. Review the scatter plot of the store’s sales from 2010 through 2021 to answer the questions. See attached as image. Here is the data for Fiscal Year and Sales: Fiscal Year Sales 2010 $260,123.00 2011 $256,853.00 2012 $274,366.00 2013 $290,525.00 2014 $322,318.00 2015 $380,921.00 2016 $541,925.00 2017 $909,050.00 2018 $1,817,521.00 2019 $3,206,564.00 2020 $4,921,005.00 2021 $5,686,338.00 Time series decomposition seeks to separate the time series (Y) into 4 components: trend (T), cycle (C), seasonal (S), and irregular (I). What is the difference between these components? The model can be additive or multiplicative. When do you use each? Review the scatter plot of the exponential trend of the time series data. Do you observe a trend? If so, what type of trend do you observe? What predictions might you make about the store’s annual sales over the next few years?Recurrent upward and downward movements in a time series are called_________________. a. Secular Trend b. Irregular Variations c. Cyclical Variations d. Seasonal Variations