The following table shows a company's annual revenue (in billions of dollars) for 2009 to 2014. Year Period (t) Revenue (S billions) 2009 23.6 2010 2 29.3 2011 37.9 2012 4 50.2 2013 59.9 2014 6 66.7 KUNO (a) Construct a time series plot. 50 50 40 30 30 30 20 10 20 10- 20 20 10 10 3 6 1 6 3. Period Period Period Period What type of pattern exists in the data? O The time series plot shows a downward linear trend. O The time series plot shows an upward linear trend. O The time series plot shows an upward curvilinear trend. O The time series plot shows a downward curvilinear trend. (b) Develop a linear trend equation for this time series to forecast revenue (in billions of dollars). (Round your numerical values to three decimal places.) 7,--18323.211 + 9.131 (e) What is the average revenue increase per year (in billions of dollars) that this company has been realizing? (Round your answer to three decimal places.) s 18.03 x billion (d) Compute an estimate of this company's revenue (in bilions of dollars) for 2015. (Round your answer to two decimal places.) s75.75 x billion
The following table shows a company's annual revenue (in billions of dollars) for 2009 to 2014. Year Period (t) Revenue (S billions) 2009 23.6 2010 2 29.3 2011 37.9 2012 4 50.2 2013 59.9 2014 6 66.7 KUNO (a) Construct a time series plot. 50 50 40 30 30 30 20 10 20 10- 20 20 10 10 3 6 1 6 3. Period Period Period Period What type of pattern exists in the data? O The time series plot shows a downward linear trend. O The time series plot shows an upward linear trend. O The time series plot shows an upward curvilinear trend. O The time series plot shows a downward curvilinear trend. (b) Develop a linear trend equation for this time series to forecast revenue (in billions of dollars). (Round your numerical values to three decimal places.) 7,--18323.211 + 9.131 (e) What is the average revenue increase per year (in billions of dollars) that this company has been realizing? (Round your answer to three decimal places.) s 18.03 x billion (d) Compute an estimate of this company's revenue (in bilions of dollars) for 2015. (Round your answer to two decimal places.) s75.75 x billion

MATLAB: An Introduction with Applications
6th Edition
ISBN:9781119256830
Author:Amos Gilat
Publisher:Amos Gilat
Chapter1: Starting With Matlab
Section: Chapter Questions
Problem 1P

Related questions
Question
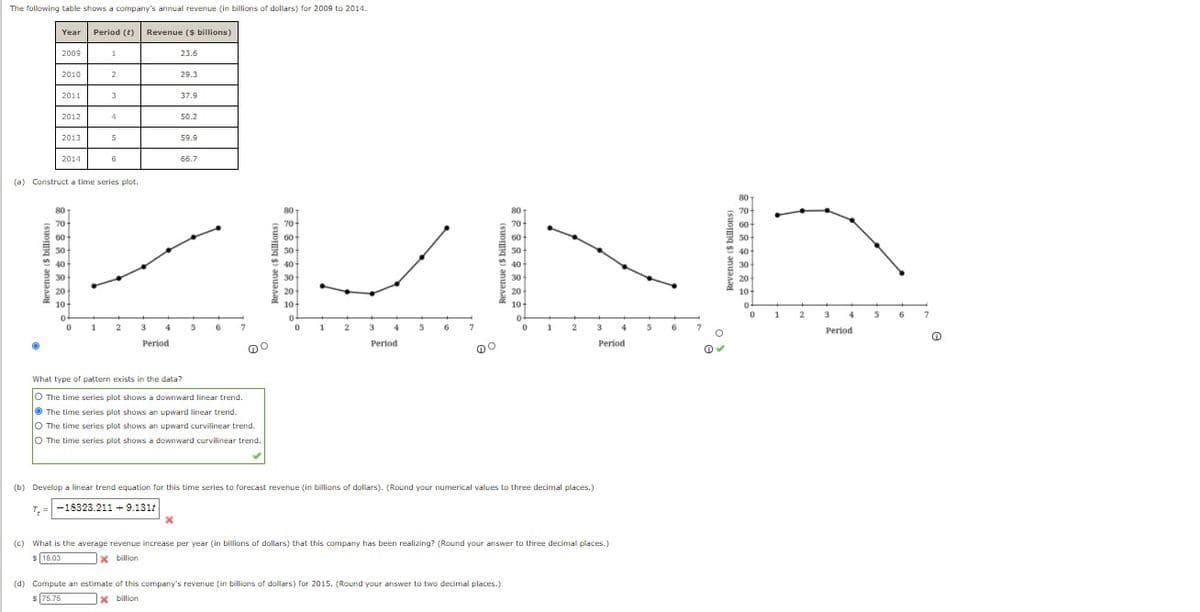
Transcribed Image Text:The following table shows a company's annual revenue (in billions of dollars) for 2009 to 2014.
Year
Period (t)
Revenue ($ billions)
2009
1
23.6
2010
2
29.3
2011
3
37.9
2012
50.2
2013
59.9
2014
6
66.7
(a) Construct a time series plot.
80
80
70
80
70
60
50
* 40
80
70
70
60
60
60
50
* 40
30
20
10-
50
50
40
40
30
30
30
20
10-
20
10-
20
0-
1
10
3
4
6
1
3
4
1
2
3
4
1
2
3
4
Period
Period
Period
Period
What type of pattern exists in the data?
O The time series plot shows a downward linear trend.
O The time series plot shows an upward linear trend.
O The time series plot shows an upward curvilinear trend.
O The time series plot shows a downward curvilinear trend.
(b) Develop a linear trend equation for this time series to forecast revenue (in billions of dollars). (Round your numerical values to three decimal places.)
T, =-18323.211 +9,131t
(c) What is the average revenue increase per year (in billions of dollars) that this company has been realizing? (Round your answer to three decimal places.)
$ 18.03
x billion
(d) Compute an estimate of this company's revenue (in billions of dollars) for 2015. (Round your answer to two decimal places.)
S75.75
X billion
Revenue ($ billions)
Revenue ($ billions)
(suoma s) anuaaay
Revenue ($ billions)
Expert Solution
This question has been solved!
Explore an expertly crafted, step-by-step solution for a thorough understanding of key concepts.

This is a popular solution!

Trending now
This is a popular solution!

Step by step
Solved in 2 steps with 1 images

Knowledge Booster


Learn more about
Need a deep-dive on the concept behind this application? Look no further. Learn more about this topic, statistics and related others by exploring similar questions and additional content below.Recommended textbooks for you
MATLAB: An Introduction with Applications
Statistics
ISBN:
9781119256830
Author:
Amos Gilat
Publisher:
John Wiley & Sons Inc

Probability and Statistics for Engineering and th…
Statistics
ISBN:
9781305251809
Author:
Jay L. Devore
Publisher:
Cengage Learning

Statistics for The Behavioral Sciences (MindTap C…
Statistics
ISBN:
9781305504912
Author:
Frederick J Gravetter, Larry B. Wallnau
Publisher:
Cengage Learning
MATLAB: An Introduction with Applications
Statistics
ISBN:
9781119256830
Author:
Amos Gilat
Publisher:
John Wiley & Sons Inc
Probability and Statistics for Engineering and th…
Statistics
ISBN:
9781305251809
Author:
Jay L. Devore
Publisher:
Cengage Learning
Statistics for The Behavioral Sciences (MindTap C…
Statistics
ISBN:
9781305504912
Author:
Frederick J Gravetter, Larry B. Wallnau
Publisher:
Cengage Learning

Elementary Statistics: Picturing the World (7th E…
Statistics
ISBN:
9780134683416
Author:
Ron Larson, Betsy Farber
Publisher:
PEARSON

The Basic Practice of Statistics
Statistics
ISBN:
9781319042578
Author:
David S. Moore, William I. Notz, Michael A. Fligner
Publisher:
W. H. Freeman

Introduction to the Practice of Statistics
Statistics
ISBN:
9781319013387
Author:
David S. Moore, George P. McCabe, Bruce A. Craig
Publisher:
W. H. Freeman