Consider the market for mountain bikes. The following graph shows the demand and supply for mountain bikes before the government imposes any tаxes. First, use the black point (plus symbol) to indicate the equilibrium price and quantity of mountain bikes in the absence of a tax. Then use the green point (triangle symbol) to shade the area representing total consumer surplus (CS) at the equilibrium price. Next, use the purple point (diamond symbol) to shade the area representing total producer surplus (PS) at the equilibrium price. Before Tax 200 180 Equilibrium 160 Demand 140 120 Consumer Surplus 100 80 Supply Producer Surplus 60 40 20 50 100 150 200 250 300 350 400 450 500 QUANTITY (Bikes) Suppose the government imposes an excise tax on mountain bikes. The black line on the following graph shows the tax wedge created by a tax of $40 per bike. PRICE (Dollars per bike)
Consider the market for mountain bikes. The following graph shows the demand and supply for mountain bikes before the government imposes any tаxes. First, use the black point (plus symbol) to indicate the equilibrium price and quantity of mountain bikes in the absence of a tax. Then use the green point (triangle symbol) to shade the area representing total consumer surplus (CS) at the equilibrium price. Next, use the purple point (diamond symbol) to shade the area representing total producer surplus (PS) at the equilibrium price. Before Tax 200 180 Equilibrium 160 Demand 140 120 Consumer Surplus 100 80 Supply Producer Surplus 60 40 20 50 100 150 200 250 300 350 400 450 500 QUANTITY (Bikes) Suppose the government imposes an excise tax on mountain bikes. The black line on the following graph shows the tax wedge created by a tax of $40 per bike. PRICE (Dollars per bike)

Chapter4: Markets In Action
Section: Chapter Questions
Problem 12SQ

Related questions
Question
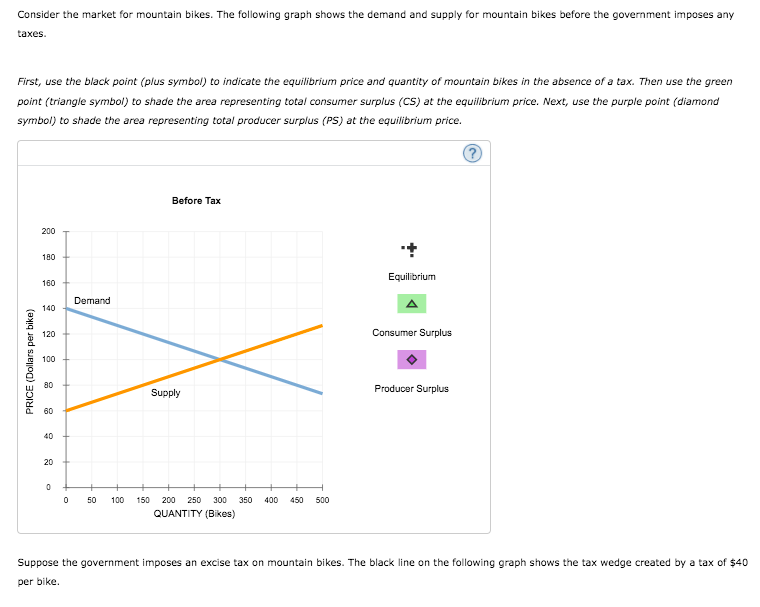
Transcribed Image Text:Consider the market for mountain bikes. The following graph shows the demand and supply for mountain bikes before the government imposes any
taxes.
First, use the black point (plus symbol) to indicate the equilibrium price and quantity of mountain bikes in the absence of a tax. Then use the green
point (triangle symbol) to shade the area representing total consumer surplus (CS) at the equilibrium price. Next, use the purple point (diamond
symbol) to shade the area representing total producer surplus (PS) at the equilibrium price.
Before Tax
200
180
Equilibrium
160
Demand
140
120
Consumer Surplus
100
80
Producer Surplus
Supply
60
40
20
50
100 150
200
250
300
350
400
450
500
QUANTITY (Bikes)
Suppose the government imposes an excise tax on mountain bikes. The black line on the following graph shows the tax wedge created by a tax of $40
per bike.
PRICE (Dollars per bike)
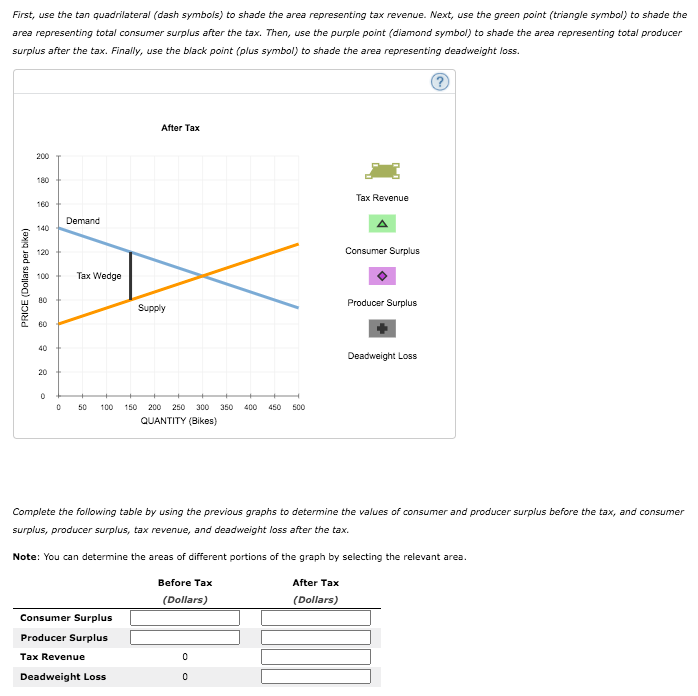
Transcribed Image Text:First, use the tan quadrilateral (dash symbols) to shade the area representing tax revenue. Next, use the green point (triangle symbol) to shade the
area representing total consumer surplus after the tax. Then, use the purple point (diamond symbol) to shade the area representing total producer
surplus after the tax. Finally, use the black point (plus symbol) to shade the area representing deadweight loss.
After Tax
200
180
Tax Revenue
160
Demand
140
120
Consumer Surplus
100
Tax Wedge
Producer Surplus
Supply
60
40
Deadweight Loss
20
50
100
150
200
250
300
350
400
450
500
QUANTITY (BIikes)
Complete the following table by using the previous graphs to determine the values of consumer and producer surplus before the tax, and consumer
surplus, producer surplus, tax revenue, and deadweight loss after the tax.
Note: You can determine the areas of different portions of the graph by selecting the relevant area.
Before Tax
After Tax
(Dollars)
(Dollars)
Consumer Surplus
Producer Surplus
Tax Revenue
Deadweight Loss
PRICE (Dollars per bike)
Expert Solution
This question has been solved!
Explore an expertly crafted, step-by-step solution for a thorough understanding of key concepts.

This is a popular solution!

Trending now
This is a popular solution!

Step by step
Solved in 2 steps with 2 images

Recommended textbooks for you


Principles of Macroeconomics (MindTap Course List)
Economics
ISBN:
9781305971509
Author:
N. Gregory Mankiw
Publisher:
Cengage Learning

Principles of Microeconomics
Economics
ISBN:
9781305156050
Author:
N. Gregory Mankiw
Publisher:
Cengage Learning