Complete the following table by using the previous graphs to determine the values of consumer and producer surplus before the tax, and consumer surplus, producer surplus, tax revenue, and deadweight loss after the tax. Note: You can determine the areas of different portions of the graph by selecting the relevant area. ----- Before Tax (Dollars) After Tax (Dollars) Consumer Surplus ?? ?? Producer Surplus ?? ?? Tax Revenue 0 ?? Deadweight loss 0 ??
Complete the following table by using the previous graphs to determine the values of consumer and producer surplus before the tax, and consumer surplus, producer surplus, tax revenue, and deadweight loss after the tax. Note: You can determine the areas of different portions of the graph by selecting the relevant area. ----- Before Tax (Dollars) After Tax (Dollars) Consumer Surplus ?? ?? Producer Surplus ?? ?? Tax Revenue 0 ?? Deadweight loss 0 ??

Chapter1: Making Economics Decisions
Section: Chapter Questions
Problem 1QTC

Related questions
Question
(ALL OWNERSHIP GOES TO CENGAGE)
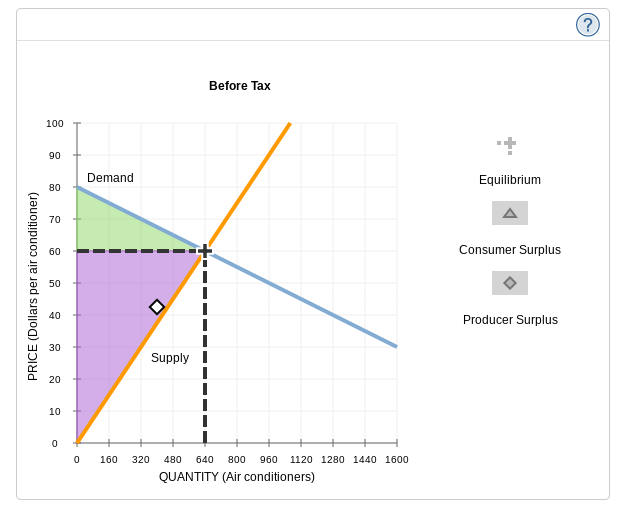
Consider the market for air conditioning units. The following graph shows the demand and supply for air conditioning units before the government imposes any taxes.
First, use the black point (plus symbol) to indicate the equilibrium price and quantity of air conditioning units in the absence of a tax. Then use the green point (triangle symbol) to shade the area representing total consumer surplus (CS) at the equilibrium price. Next, use the purple point (diamond symbol) to shade the area representing total producer surplus (PS) at the equilibrium price.
(image below)
2. Taxes and welfare
Consider the market for air conditioning units. The following graph shows the demand and supply for air conditioning units before the government imposes any taxes.
First, use the black point (plus symbol) to indicate the equilibrium price and quantity of air conditioning units in the absence of a tax. Then use the green point (triangle symbol) to shade the area representing total consumer surplus (CS) at the equilibrium price. Next, use the purple point (diamond symbol) to shade the area representing total producer surplus (PS) at the equilibrium price.
Before TaxEquilibriumConsumer SurplusProducer Surplus016032048064080096011201280144016001009080706050403020100PRICE (Dollars per air conditioner)QUANTITY (Air conditioners)DemandSupplyArea: 19200
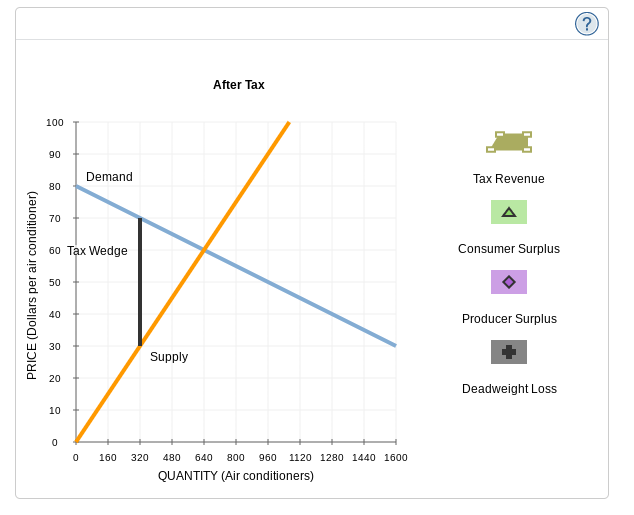
Suppose the government imposes an excise tax on air conditioning units. The black line on the following graph shows the tax wedge created by a tax of $40 per air conditioner.
First, use the tan quadrilateral (dash symbols) to shade the area representing tax revenue. Next, use the green point (triangle symbol) to shade the area representing total consumer surplus after the tax. Then, use the purple point (diamond symbol) to shade the area representing total producer surplus after the tax. Finally, use the black point (plus symbol) to shade the area representing deadweight loss .
(image below)
Complete the following table by using the previous graphs to determine the values of consumer and producer surplus before the tax, and consumer surplus, producer surplus, tax revenue, and deadweight loss after the tax.
Note: You can determine the areas of different portions of the graph by selecting the relevant area.
| ----- | Before Tax (Dollars) | After Tax (Dollars) |
| Consumer Surplus | ?? | ?? |
| Producer Surplus | ?? | ?? |
| Tax Revenue | 0 | ?? |
| Deadweight loss | 0 | ?? |
Transcribed Image Text:PRICE (Dollars per air conditioner)
100
90
80
70
60
50
40
30
20
10
0
Demand
Supply
Before Tax
0 160 320 480 640 800 960 1120 1280 1440 1600
QUANTITY (Air conditioners)
Equilibrium
Consumer Surplus
Producer Surplus
(?)
Transcribed Image Text:PRICE (Dollars per air conditioner)
100
90
80
70
60 Tax Wedge
50
40
30
20
10
Demand
0
Supply
After Tax
0 160 320 480 640 800 960 1120 1280 1440 1600
QUANTITY (Air conditioners)
Tax Revenue
A
Consumer Surplus
Producer Surplus
Deadweight Loss
Expert Solution
This question has been solved!
Explore an expertly crafted, step-by-step solution for a thorough understanding of key concepts.

This is a popular solution!

Trending now
This is a popular solution!

Step by step
Solved in 2 steps with 2 images

Knowledge Booster


Learn more about
Need a deep-dive on the concept behind this application? Look no further. Learn more about this topic, economics and related others by exploring similar questions and additional content below.Recommended textbooks for you

Principles of Economics (12th Edition)
Economics
ISBN:
9780134078779
Author:
Karl E. Case, Ray C. Fair, Sharon E. Oster
Publisher:
PEARSON

Engineering Economy (17th Edition)
Economics
ISBN:
9780134870069
Author:
William G. Sullivan, Elin M. Wicks, C. Patrick Koelling
Publisher:
PEARSON
Principles of Economics (12th Edition)
Economics
ISBN:
9780134078779
Author:
Karl E. Case, Ray C. Fair, Sharon E. Oster
Publisher:
PEARSON
Engineering Economy (17th Edition)
Economics
ISBN:
9780134870069
Author:
William G. Sullivan, Elin M. Wicks, C. Patrick Koelling
Publisher:
PEARSON

Principles of Economics (MindTap Course List)
Economics
ISBN:
9781305585126
Author:
N. Gregory Mankiw
Publisher:
Cengage Learning

Managerial Economics: A Problem Solving Approach
Economics
ISBN:
9781337106665
Author:
Luke M. Froeb, Brian T. McCann, Michael R. Ward, Mike Shor
Publisher:
Cengage Learning

Managerial Economics & Business Strategy (Mcgraw-…
Economics
ISBN:
9781259290619
Author:
Michael Baye, Jeff Prince
Publisher:
McGraw-Hill Education