Consider the market for new economics textbooks. The following graph shows the demand curve for new textbooks. Suppose that the publisher issues a new edition every four years and that a printed copy of the new 2018 textbook sells for a retail price of $100. On the following graph, use the black point (cross symbol) to indicate the point on the demand curve at $100. (Note: Dashed drop lines w automatically extend to both axes.) Then answer the question that follows. The market for new economics textbooks (Print only) 200 180 Demand 160 140 120 100 80 Revenue in 2019 60 Demand 40 20 20 40 60 80 100 120 140 160 180 200 QUANTITY OF ECONOMICS TEXTBOOKS (Thousands of copies) In 2018, at $100, copies of the textbook are demanded, and the publisher's revenue is s PRICE (Dollars per copy)
Consider the market for new economics textbooks. The following graph shows the demand curve for new textbooks. Suppose that the publisher issues a new edition every four years and that a printed copy of the new 2018 textbook sells for a retail price of $100. On the following graph, use the black point (cross symbol) to indicate the point on the demand curve at $100. (Note: Dashed drop lines w automatically extend to both axes.) Then answer the question that follows. The market for new economics textbooks (Print only) 200 180 Demand 160 140 120 100 80 Revenue in 2019 60 Demand 40 20 20 40 60 80 100 120 140 160 180 200 QUANTITY OF ECONOMICS TEXTBOOKS (Thousands of copies) In 2018, at $100, copies of the textbook are demanded, and the publisher's revenue is s PRICE (Dollars per copy)

Chapter5: Markets In Motion And Price Controls
Section: Chapter Questions
Problem 10P

Related questions
Question
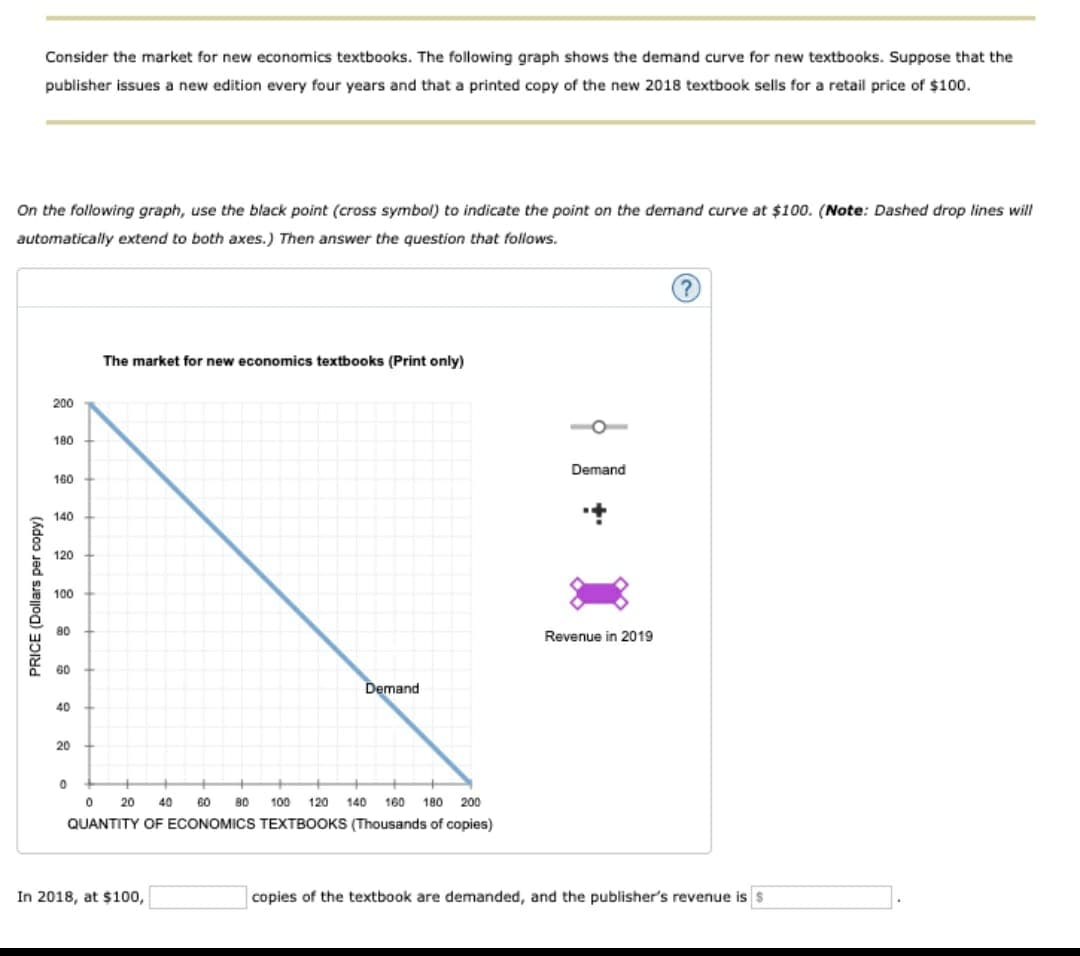
Transcribed Image Text:Consider the market for new economics textbooks. The following graph shows the demand curve for new textbooks. Suppose that the
publisher issues a new edition every four years and that a printed copy of the new 2018 textbook sells for a retail price of $100.
On the following graph, use the black point (cross symbol) to indicate the point on the demand curve at $100. (Note: Dashed drop lines will
automatically extend to both axes.) Then answer the question that follows.
The market for new economics textbooks (Print only)
200
180
Demand
160
140
120
100
80
Revenue in 2019
60
Demand
40
20
20
40
60
80
100
120
140
160
180 200
QUANTITY OF ECONOMICS TEXTBOOKS (Thousands of copies)
In 2018, at $100,
copies of the textbook are demanded, and the publisher's revenue is s
PRICE (Dollars per copy)
Expert Solution
This question has been solved!
Explore an expertly crafted, step-by-step solution for a thorough understanding of key concepts.

This is a popular solution!

Trending now
This is a popular solution!

Step by step
Solved in 2 steps with 1 images

Knowledge Booster


Learn more about
Need a deep-dive on the concept behind this application? Look no further. Learn more about this topic, economics and related others by exploring similar questions and additional content below.Recommended textbooks for you
Exploring Economics
Economics
ISBN:
9781544336329
Author:
Robert L. Sexton
Publisher:
SAGE Publications, Inc

Essentials of Economics (MindTap Course List)
Economics
ISBN:
9781337091992
Author:
N. Gregory Mankiw
Publisher:
Cengage Learning

Brief Principles of Macroeconomics (MindTap Cours…
Economics
ISBN:
9781337091985
Author:
N. Gregory Mankiw
Publisher:
Cengage Learning
Exploring Economics
Economics
ISBN:
9781544336329
Author:
Robert L. Sexton
Publisher:
SAGE Publications, Inc
Essentials of Economics (MindTap Course List)
Economics
ISBN:
9781337091992
Author:
N. Gregory Mankiw
Publisher:
Cengage Learning
Brief Principles of Macroeconomics (MindTap Cours…
Economics
ISBN:
9781337091985
Author:
N. Gregory Mankiw
Publisher:
Cengage Learning


Economics (MindTap Course List)
Economics
ISBN:
9781337617383
Author:
Roger A. Arnold
Publisher:
Cengage Learning