Consider the summary of a survey conducted by a marketing firm regarding environmental protection policies among residents of two regions of the country. Policy Good for. Business & for Business &Region1, "Good for Business & Jobs" is the dominant Policy Threat Find the p-value for testing the hypothesis that for Region Jobs Region1 Region2 158 Jobs opinion on environmental protection policies by taking more than half of the support of responders of the 190 125 140 survey. Type your numerical answer here. Numbers only
Consider the summary of a survey conducted by a marketing firm regarding environmental protection policies among residents of two regions of the country. Policy Good for. Business & for Business &Region1, "Good for Business & Jobs" is the dominant Policy Threat Find the p-value for testing the hypothesis that for Region Jobs Region1 Region2 158 Jobs opinion on environmental protection policies by taking more than half of the support of responders of the 190 125 140 survey. Type your numerical answer here. Numbers only

MATLAB: An Introduction with Applications
6th Edition
ISBN:9781119256830
Author:Amos Gilat
Publisher:Amos Gilat
Chapter1: Starting With Matlab
Section: Chapter Questions
Problem 1P

Related questions
Question
D2)
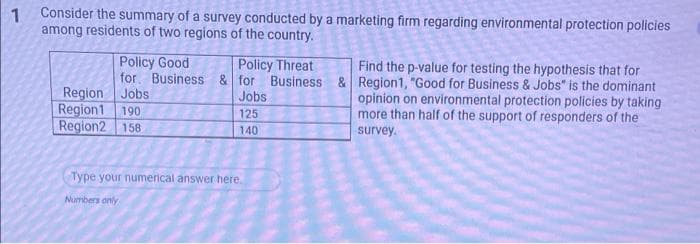
Transcribed Image Text:1 Consider the summary of a survey conducted by a marketing firm regarding environmental protection policies
among residents of two regions of the country.
Policy Good
for. Business & for Business &Region1, "Good for Business & Jobs" is the dominant
Policy Threat
Find the p-value for testing the hypothesis that for
Region Jobs
Jobs
opinion on environmental protection policies by taking
more than half of the support of responders of the
survey.
Region1
190
125
Region2 158
140
Type your numerical answer here.
Numbers only
Expert Solution
This question has been solved!
Explore an expertly crafted, step-by-step solution for a thorough understanding of key concepts.

Step by step
Solved in 3 steps with 3 images

Recommended textbooks for you
MATLAB: An Introduction with Applications
Statistics
ISBN:
9781119256830
Author:
Amos Gilat
Publisher:
John Wiley & Sons Inc

Probability and Statistics for Engineering and th…
Statistics
ISBN:
9781305251809
Author:
Jay L. Devore
Publisher:
Cengage Learning

Statistics for The Behavioral Sciences (MindTap C…
Statistics
ISBN:
9781305504912
Author:
Frederick J Gravetter, Larry B. Wallnau
Publisher:
Cengage Learning
MATLAB: An Introduction with Applications
Statistics
ISBN:
9781119256830
Author:
Amos Gilat
Publisher:
John Wiley & Sons Inc
Probability and Statistics for Engineering and th…
Statistics
ISBN:
9781305251809
Author:
Jay L. Devore
Publisher:
Cengage Learning
Statistics for The Behavioral Sciences (MindTap C…
Statistics
ISBN:
9781305504912
Author:
Frederick J Gravetter, Larry B. Wallnau
Publisher:
Cengage Learning

Elementary Statistics: Picturing the World (7th E…
Statistics
ISBN:
9780134683416
Author:
Ron Larson, Betsy Farber
Publisher:
PEARSON

The Basic Practice of Statistics
Statistics
ISBN:
9781319042578
Author:
David S. Moore, William I. Notz, Michael A. Fligner
Publisher:
W. H. Freeman

Introduction to the Practice of Statistics
Statistics
ISBN:
9781319013387
Author:
David S. Moore, George P. McCabe, Bruce A. Craig
Publisher:
W. H. Freeman