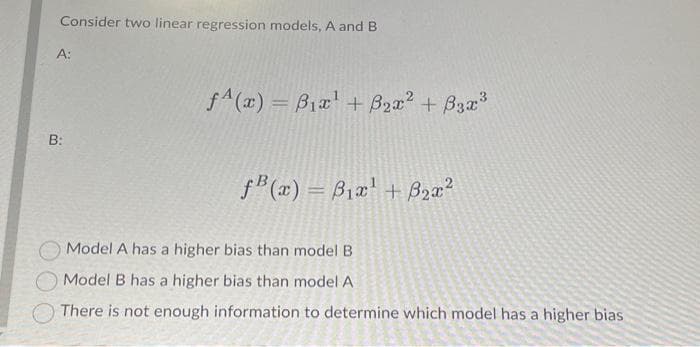
Consider two linear regression models, A and B A: B: f(x) = B₁x¹ + B₂x² + 3x³ f(x) = B₁x¹ + ₂x² Model A has a higher bias than model B Model B has a higher bias than model A There is not enough information to determine which model has a higher bias


Q: Suppose the PDF of X is given by fx(x) = 5e¯³×l(o,∞)(x). Find its CDF.
A:
Q: The number of successes and the sample size for a simple random sample from a population are given…
A: The given information is x=7,n=28,H0:p=0.4,Ha:p<0.4,α=0.10.
Q: A bag contains 9 Blue balls, 10 Red balls, and 12 Green balls. Two balls are going to be drawn from…
A: Concept : Probability = favorable / total Blue = 9 Red = 10 Green = 12 Total = 12 + 10 + 9 =…
Q: A car insurance company tells its prospective customers that they can save an average of at least…
A: Sample size n=130 Sample mean x¯=97.50 Sample standard deviation s=27.50 Claim: Customers can save…
Q: The following table shows actual and forecasted values for sales over time. Year 2014 2015 2016 2017…
A: The question is about forecasting Given : To find : Value of MAD
Q: score for 15 students is 81.1 with a standard deviation of 7.4. Test the professor's claim at the…
A: Let μ1 and μ2 be the two exam scores in class A, and class B. Given that, For class…
Q: Define: class boundary Class boundary specifies the span of data values that fall within a class.…
A: Class boundaries are used to separate groups (or class) of a data set. For second class, it is the…
Q: Is the variance for the amount of money, in dollars, that shoppers spend on Saturdays at the mall…
A: Saturday Sunday 75 44 18 58 150 61 94 19 62 99 73 60 62 89 0 137 124 82 50 39…
Q: When subjects were treated with a drug, their systolic blood pressure readings (in mm Hg) were…
A: The data shows the systolic blood pressure readings readings of before and after the drug was taken.
Q: The boxplots below display annual incomes (in thousands of dollars) of households in two cities. O…
A: The boxplots for two cities are given.
Q: 3) The finished inside diameter of a Piston ring is normally distributed with a mean of 10…
A: The finished inside diameter of a piston ring is normally distributed with a mean of 10 centimeter…
Q: 6) Consider the random variable Z₂ = cos (2 * π/n) where Yn is binomial(n.p) a. What is its…
A: There is a random variable Zn, which is defined as the cosine of 2π times a binomially distributed…
Q: random sample of 473 students and professors were asked about their political party affiliation. The…
A: Total people=473
Q: what statistical tool to use in sample of 40 students: significant difference between the set of…
A: Statistical tools are used for planning, designing, analyzing and interpreting the results to make…
Q: Researchers want to know about the true proportion of adults with at least a high school education.…
A: The no. of sample size, i.e., the sampled no. of adults, n=1000. The no. of sampled adults, who have…
Q: Please no written by hand solution and no img In a random survey of 40 algebra 1 students at A&M…
A: Number of students who love their math class = 30 Total number of students surveyed = 40
Q: In applying statistics, we make decisions with less than 100% certainty (We are not always correct…
A: In applying statistics, we make decisions with less than 100% certainty (We are not always correct…
Q: X is the Binomial Random Variable which counts the number of students who passed an exam. If the…
A: The class has 93 students and the probability that a single student passes the exam is 0.75.
Q: In a certain area, 37% of people own a dog. Complete parts a and b below. a. Find the probability…
A: Sample size (n) = 15P(own a dog) = p = 0.37Let 'X' be the no. of people own a dogX~ Binomial (n = 15…
Q: There is very close to an even chance that both children in a two-child family will be of the same…
A: We are given that: There is very close to an even chance that both children in a two-child family…
Q: Let X ~t(30). Use tables to determine the values b, c such that P(-b≤X ≤ b) = 0.90; P(X > c) =…
A: We have given that, X~t30 i.e. The random variable X follows a t-distribution with 30 degrees of…
Q: Critical values for quick reference during this activity. Confidence level Critical value z* = 1.645…
A: From the provided information, Margin of error (E) = 1.59% = 0.0159 Confidence level = 90%
Q: 3. You are in charge of a delivery company that has a large fleet of delivery truck. The distance a…
A: The sample size is 36, the sample mean is 55 and the sample variance is 49.
Q: A city council is trying to determine if library B, with extended hours, has a higher proportion of…
A: The given results shows two-proportion z test.
Q: Question 1: Visitors to a Skee-Ball booth attempt to roll a ball into a central target. Define the…
A:
Q: If the test statistic is 1.95 on the Z distribution at a 3% significance level for a right-sided…
A: The test is right tailed.
Q: With this, answer the following problems and questions below. 1. Identify the central tendency of…
A: As per the Bartleby guildlines we have to solve first question and rest can be reposted.... We have…
Q: The numbers of trading cards owned by 8 middle-school students are given below. (Note that these are…
A: Answer:- Given increasing ordered data is, 344, 405, 515, 522, 541, 588, 595, 602 Total number of…
Q: Find the margin of error for the 95% confidence interval used to estimate the population proportion.…
A: Confidence level = 95% Sample size (n) = 2440 Sample proportion (p̂) = 0.70
Q: 6. The disturbance term in a regression model yt = a + Bxt + ut, captures: a) Some determinants of…
A: Sometimes, the response variable, i.e. Y, depends not only on the explanatory variable that we have…
Q: Use graphical approximation techniques or an equation solver to approximate the desired interest…
A: ANSWER: To approximate the annual nominal rate compounded monthly mathematically, we can use an…
Q: Practice: 1) Find the number of possible outcomes. List all the possible outcomes. A stack of cards…
A: “Since you have posted multiple questions, we will provide the solution only to the first question…
Q: The number of births per woman in China is 1.6 down from 5.91 in 1966. This fertility rate has been…
A: # of births Frequency 0 5 1 30 2 10
Q: Find the margin of error for the 95% confidence interval used to estimate the population proportion.…
A: p = 0.70 n = 2440
Q: In each of the following situations, indicate whether Walters, CPA is using unrestricted random…
A: We need to determine if the given questions were chosen using UR, SR, H, or B.
Q: the following correctly in-text cited? According to David Plowright (2011) viral sampling known as…
A: To verify whether this citation is correct, we will refer to the original source.
Q: the answer was incorrect
A: Answer…
Q: Find the variance and standard deviation of the data below: Classes 1-10 11-20 21-30 31-40 41-50…
A: The question is about frequency distribution Given : To find : 1 ) Variance of the data 2 ) Std.…
Q: 39/ iF X is a random Variable has poisson distribution with 2=4 Find P(X=3)
A: From the provided information, X is a random variable has Poisson distribution with λ = 4
Q: The median undergraduate grade point average (GPA) for students accepted at a random sample of 10…
A: The sample size, i.e., the sampled no. of school, n=10. The sample mean, x¯=3.75 And the standard…
Q: A group of people were asked if some psychics can help solve murder cases. 220 responded "yes", and…
A: Responded Yes = 220 Responded no = 482 Total = 702
Q: For each of the following functions, Find c so that the function is a PDF. a) (cx² + x) I[0,1](×).…
A: The value of C, so that the given functions are a pdf.
Q: Find the margin of error for the 95% confidence interval used to estimate the population proportion.…
A: Given that n= 2440p^=70%=0.7 The confidence level is 95% confidence level.Significance…
Q: Find the expected values for the null hypothesis. Face to Face
A: The data given on small business consulting work in New Orleans changed after Hurricane Katrina.…
Q: The mean height for baby African giraffes is = 68.5 inches, with a standard deviation of = 3…
A: we have given baby giraffes baby zebras mean (xbar) 68.5 62.7 standard deviation (sigma) 3…
Q: Given the following data: Vegetable Sweet Carrot Yes Potato No Onion Yes Celery No Starchy Firm Yes…
A: The data is as follows: Vegetable Sweet Starchy Firm Vitamin Water Calories/100g Carrot Yes Yes…
Q: Compute most appropriate measure of centeral tendency and dipe
A: Consider the data values for the variable "Albumin level". Albumin (g/dl) 3.5 4 4.2 4.8…
Q: Fill the Following blanks with the right answer! □ PIZ-1.39)= @ P(Z > 1₁96) = Plo. 65 17)
A:
Q: 4. Individuals of various age groups (18-35; 36-55; 56-75) were asked about their trust (measured on…
A: The question is about ANOVA Given : Sample size of age grp. 18-35 ( n1 ) = 22 Mean trust of age grp.…
Q: Use R to simulate N and compute T 104 random samples (Z₁,..., Zn) from the normal(0,1) distribution…
A: In this exercise, we are asked to use the R programming language to simulate N = 104 random samples…

Step by step
Solved in 3 steps

- The following fictitious table shows kryptonite price, in dollar per gram, t years after 2006. t= Years since 2006 0 1 2 3 4 5 6 7 8 9 10 K= Price 56 51 50 55 58 52 45 43 44 48 51 Make a quartic model of these data. Round the regression parameters to two decimal places.Olympic Pole Vault The graph in Figure 7 indicates that in recent years the winning Olympic men’s pole vault height has fallen below the value predicted by the regression line in Example 2. This might have occurred because when the pole vault was a new event there was much room for improvement in vaulters’ performances, whereas now even the best training can produce only incremental advances. Let’s see whether concentrating on more recent results gives a better predictor of future records. (a) Use the data in Table 2 (page 176) to complete the table of winning pole vault heights shown in the margin. (Note that we are using x=0 to correspond to the year 1972, where this restricted data set begins.) (b) Find the regression line for the data in part ‚(a). (c) Plot the data and the regression line on the same axes. Does the regression line seem to provide a good model for the data? (d) What does the regression line predict as the winning pole vault height for the 2012 Olympics? Compare this predicted value to the actual 2012 winning height of 5.97 m, as described on page 177. Has this new regression line provided a better prediction than the line in Example 2?Suppose there is 1 dependent variable (dissolved oxygen, Y) and 3 independent variables (water temp X1, depth X2, and hardness of water X3). Below is the result of the multiple linear regression.Which of the following is the equation of the multiple regression model? Y = 4.36 + 0.37X1 + 0.24X2 + 0.04X3 Y = 0.00 + 0.02X1 + 0.56X2 + 0.37X3 Y = 24.84 - 1.17X1 - 0.15X2 - 0.04X3 Y = 5.69 – 3.20X1 - 0.61X2 -0.95X3
- .The worker has noticed that the more time he spends at work (x), the less money he is likely to make (y) in conducting transactions for his firm. Which of the regression equations MOST suggests such a possibility?In an instrumental variable regression model with one regressor, Xi, andone instrument, Zi, the regression of Xi onto Zi has R2 = 0.1 and n = 50.Is Zi a strong instrument? Would your answer change if R2 = 0.1 and n = 150?Given the following table, use the matrix method to derive the constant and slope parameters of the sample regression function: Productivity index = f(Daily sleep hours). X and Y stand for the daily sleep hours and productivity index respectively. X (Daily sleep hours) Y (Productivity index)(X first then Y in pairs so )X= 2 Y= 30 X=4 Y=35 X=5 Y=40 X=6 Y=65 X=8 Y=80
- If the general linear regression model is given by the equation: y = a + b?; considering the informationobtained in Figure 2 above, compute the value of a.In a simple linear regression model, y=β0+β1x+ϵy=β0+β1x+ϵ the parameter β1β1 represents theA fitted linear regression model is (y=10+2x ). If x = 0 and the corresponding observed value of y = 9, the residual at this observation is:
- The Simple Linear Regression model is Y = b0 + b1*X1 + u and the Multiple Linear Regression model with k variables is: Y = b0 + b1*X1 + b2*X2 + ... + bk*Xk + u Y is the dependent variable, the X1, X2, ..., Xk are the explanatory variables, b0 is the intercept, b1, b2, ..., bk are the slope coefficients, and u is the error term, Yhat represents the OLS fitted values, uhat represent the OLS residuals, b0_hat represents the OLS estimated intercept, and b1_hat, b2_hat,..., bk_hat, represent the OLS estimated slope coefficients. QUESTION 7 In the MLR model, the assumption of ‘linearity in parameters’ is violated if: one of the slope coefficients appears as a power (e.g. Y = b0 + b1*(X1^b2) + b3*X2 + u) the model includes the reciprocal of a variable (e.g. 1/X1) the model includes a variable squared (e.g. X1^2) the model includes a variable in its logarithmic form (i.e. log(X1) ) QUESTION 8 In the MLR model, the assumption of 'no perfect collinearity'…The Simple Linear Regression model is Y = b0 + b1*X1 + u and the Multiple Linear Regression model with k variables is: Y = b0 + b1*X1 + b2*X2 + ... + bk*Xk + u Y is the dependent variable, the X1, X2, ..., Xk are the explanatory variables, b0 is the intercept, b1, b2, ..., bk are the slope coefficients, and u is the error term, Yhat represents the OLS fitted values, uhat represent the OLS residuals, b0_hat represents the OLS estimated intercept, and b1_hat, b2_hat,..., bk_hat, represent the OLS estimated slope coefficients. QUESTION 1 In the SLR model, suppose the dependent variable (Y) represents the quantity consumed of apples in a particular area in tones, and the explanatory variable (X1) is the average price of apples in that area in £. If this model is estimated by OLS, then the estimated slope b1_hat, represents: by how many tones consumption of apples will change, if the average price of apples increases by £1 the predicted change in the consumption of apples (in…The Simple Linear Regression model is Y = b0 + b1*X1 + u and the Multiple Linear Regression model with k variables is: Y = b0 + b1*X1 + b2*X2 + ... + bk*Xk + u Y is the dependent variable, the X1, X2, ..., Xk are the explanatory variables, b0 is the intercept, b1, b2, ..., bk are the slope coefficients, and u is the error term, Yhat represents the OLS fitted values, uhat represent the OLS residuals, b0_hat represents the OLS estimated intercept, and b1_hat, b2_hat,..., bk_hat, represent the OLS estimated slope coefficients. QUESTION 16 In a t-test, suppose a researcher sets the significance level at 0.5%. What does this mean? The probability that the null hypothesis is true is 0.5% The researcher would be rejecting the null hypothesis, only if the p-value is less than 0.5% The researcher would be rejecting the null hypothesis, if the t-statistic is higher than 0.5 It does not mean anything, because the significance level can only be set at 5% QUESTION 17 In an MLR…


