Construct a 95% confidence interval for the true proportion. Sketch the graph of the situation. Label the point estimate and the lower and upper bounds of the confidence interval. (Round your answers to four decimal places.)
Construct a 95% confidence interval for the true proportion. Sketch the graph of the situation. Label the point estimate and the lower and upper bounds of the confidence interval. (Round your answers to four decimal places.)

College Algebra (MindTap Course List)
12th Edition
ISBN:9781305652231
Author:R. David Gustafson, Jeff Hughes
Publisher:R. David Gustafson, Jeff Hughes
Chapter8: Sequences, Series, And Probability
Section8.CT: Chapter Test
Problem 24CT: Show the sample space of the experiment: toss a fair coin three times.

Related questions
Question
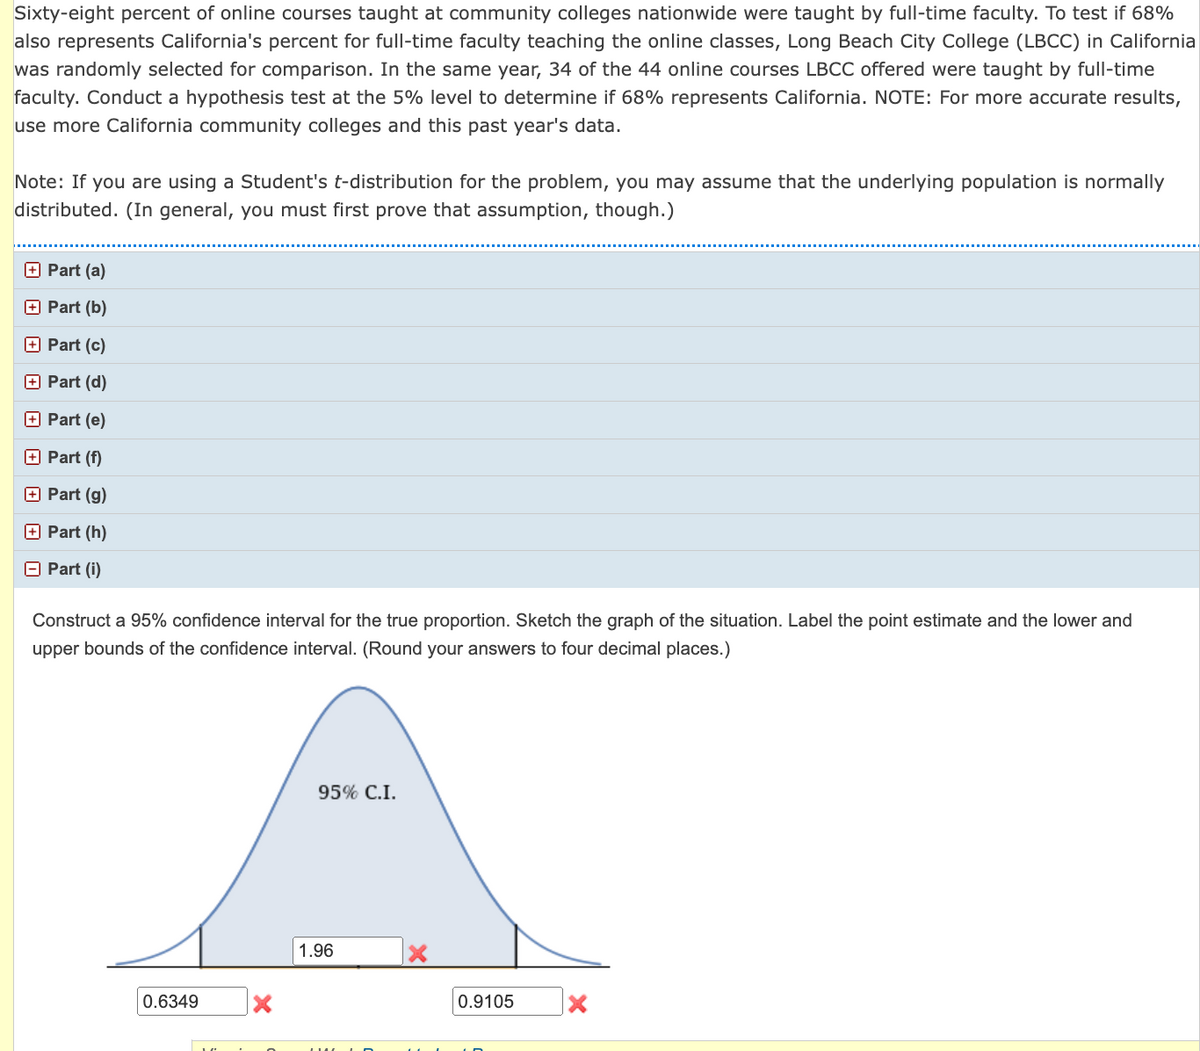
Transcribed Image Text:Sixty-eight percent of online courses taught at community colleges nationwide were taught by full-time faculty. To test if 68%
also represents California's percent for full-time faculty teaching the online classes, Long Beach City College (LBCC) in California
was randomly selected for comparison. In the same year, 34 of the 44 online courses LBCC offered were taught by full-time
faculty. Conduct a hypothesis test at the 5% level to determine if 68% represents California. NOTE: For more accurate results,
use more California community colleges and this past year's data.
Note: If you are using a Student's t-distribution for the problem, you may assume that the underlying population is normally
distributed. (In general, you must first prove that assumption, though.)
Part (a)
Part (b)
Part (c)
Part (d)
Part (e)
Part (f)
Part (g)
Part (h)
Part (i)
Construct a 95% confidence interval for the true proportion. Sketch the graph of the situation. Label the point estimate and the lower and
upper bounds of the confidence interval. (Round your answers to four decimal places.)
0.6349
A
95% C.I.
1.96
0.9105
Expert Solution
This question has been solved!
Explore an expertly crafted, step-by-step solution for a thorough understanding of key concepts.

This is a popular solution!

Trending now
This is a popular solution!

Step by step
Solved in 4 steps with 3 images

Recommended textbooks for you
College Algebra (MindTap Course List)
Algebra
ISBN:
9781305652231
Author:
R. David Gustafson, Jeff Hughes
Publisher:
Cengage Learning

Holt Mcdougal Larson Pre-algebra: Student Edition…
Algebra
ISBN:
9780547587776
Author:
HOLT MCDOUGAL
Publisher:
HOLT MCDOUGAL

College Algebra (MindTap Course List)
Algebra
ISBN:
9781305652231
Author:
R. David Gustafson, Jeff Hughes
Publisher:
Cengage Learning
Holt Mcdougal Larson Pre-algebra: Student Edition…
Algebra
ISBN:
9780547587776
Author:
HOLT MCDOUGAL
Publisher:
HOLT MCDOUGAL