Construct a frequency distribution and a frequency histogram for the data set using the indicated number of classes. Describe any patterns. Construct a frequency distribution of the data. Use the minimum data entry as the lower limit of the first class. Number of classes: 8 Class Frequency Data set: Reaction times (in milliseconds) of 30 adult females to an auditory stimulus 1. 292-319 2. 320 -347 3 3. 348-375 3 430 292 382 335 514 423 4. 376-403 389 429 372 310 440 388 350 469 389 413 444 429 5. 404 - 431 7 302 455 310 306 322 412 6. 432 - 459 4 450 388 322 360 506 415 7. 460-487 8. 488 - 515
Construct a frequency distribution and a frequency histogram for the data set using the indicated number of classes. Describe any patterns. Construct a frequency distribution of the data. Use the minimum data entry as the lower limit of the first class. Number of classes: 8 Class Frequency Data set: Reaction times (in milliseconds) of 30 adult females to an auditory stimulus 1. 292-319 2. 320 -347 3 3. 348-375 3 430 292 382 335 514 423 4. 376-403 389 429 372 310 440 388 350 469 389 413 444 429 5. 404 - 431 7 302 455 310 306 322 412 6. 432 - 459 4 450 388 322 360 506 415 7. 460-487 8. 488 - 515

Glencoe Algebra 1, Student Edition, 9780079039897, 0079039898, 2018
18th Edition
ISBN:9780079039897
Author:Carter
Publisher:Carter
Chapter10: Statistics
Section10.3: Measures Of Spread
Problem 8PPS

Related questions

Topic Video
Question
Can you please check my work
Transcribed Image Text:Construct a frequency distribution of the data. Use the minimum data entry as
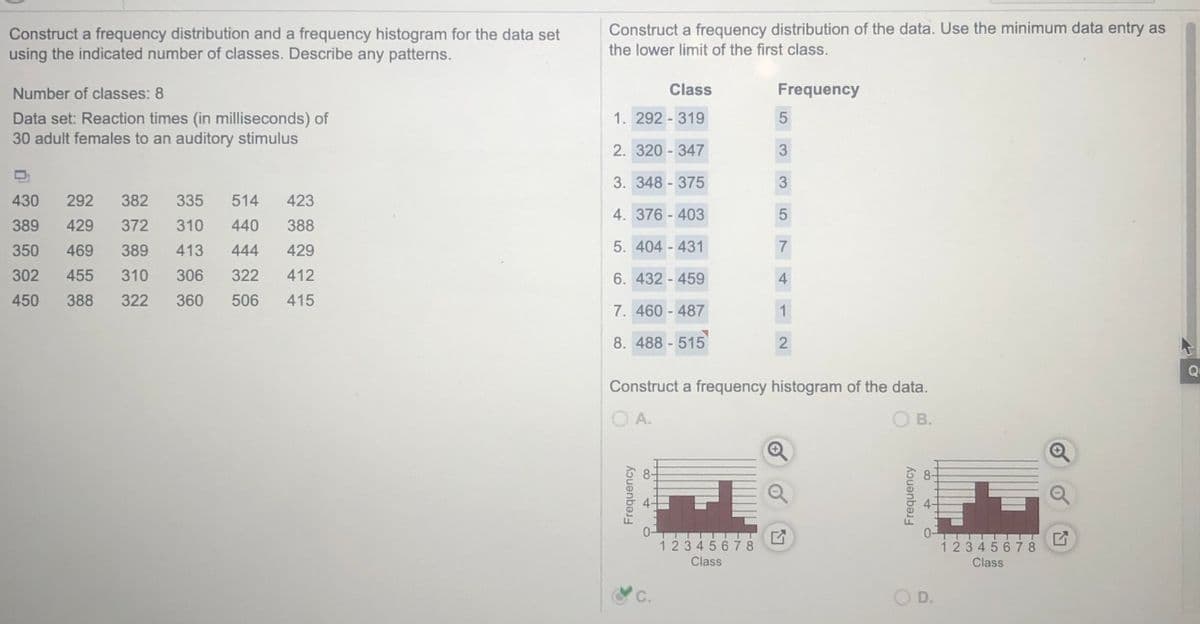
Construct a frequency distribution and a frequency histogram for the data set
using the indicated number of classes. Describe any patterns.
the lower limit of the first class.
Number of classes: 8
Class
Frequency
1. 292 - 319
Data set: Reaction times (in milliseconds) of
30 adult females to an auditory stimulus
2. 320 - 347
3. 348 - 375
430
292
382
335
514
423
4. 376 - 403
389
429
372
310
440
388
350
469
389
413
444
429
5. 404 - 431
7
302
455
310
306
322
412
6. 432 - 459
450
388
322
360
506
415
7. 460 - 487
1
8. 488 - 515
2
Qu
Construct a frequency histogram of the data.
O A.
В.
1 234 5678
Class
1234567 8
Class
С.
O D.
Frequency
Frequency
Expert Solution
This question has been solved!
Explore an expertly crafted, step-by-step solution for a thorough understanding of key concepts.

This is a popular solution!

Trending now
This is a popular solution!

Step by step
Solved in 2 steps

Knowledge Booster


Learn more about
Need a deep-dive on the concept behind this application? Look no further. Learn more about this topic, statistics and related others by exploring similar questions and additional content below.Recommended textbooks for you
Glencoe Algebra 1, Student Edition, 9780079039897…
Algebra
ISBN:
9780079039897
Author:
Carter
Publisher:
McGraw Hill
Glencoe Algebra 1, Student Edition, 9780079039897…
Algebra
ISBN:
9780079039897
Author:
Carter
Publisher:
McGraw Hill