
MATLAB: An Introduction with Applications
6th Edition
ISBN: 9781119256830
Author: Amos Gilat
Publisher: John Wiley & Sons Inc
expand_more
expand_more
format_list_bulleted
Related questions
Question
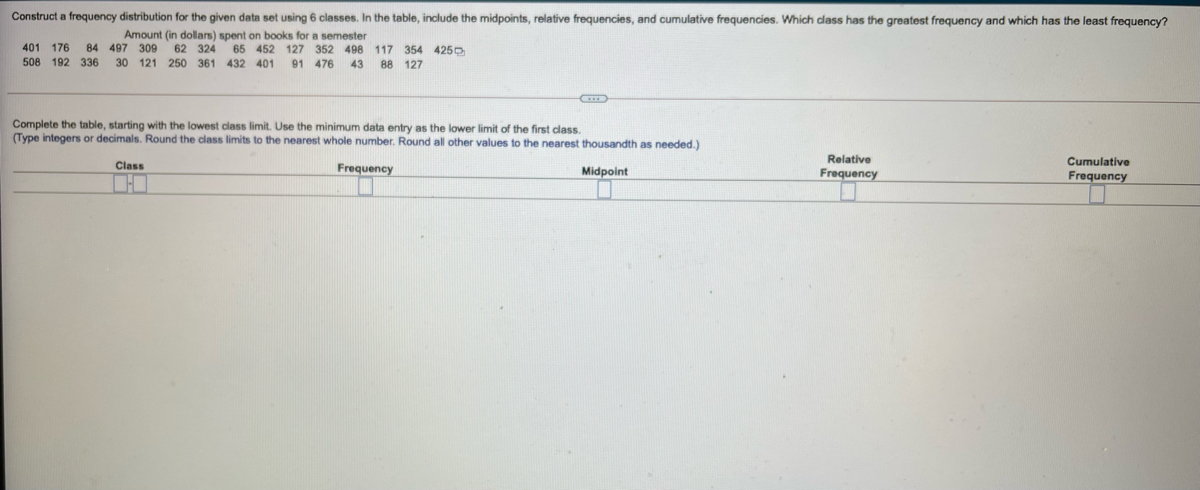

Transcribed Image Text:Construct a frequency distribution for the given data set using 6 classes. In the table, include the midpoints, relative frequencies, and cumulative frequencies. Which class has the greatest frequency and which has the least frequency?
Amount (in dollars) spent on books for a semester
401 176 84 497 309
62 324
452 127 352 498 117 354 425D
508 192 336 30 121 250 361 432 401
91 476
43
88 127
Complete the table, starting with the lowest class limit. Use the minimum data entry as the lower limit of the first class.
(Type integers
decimals. Round the class limits to the nearest whole number. Round all other values to the nearest thousandth as needed.)
Class
Relative
Cumulative
Frequency
Midpoint
Frequency
Frequency
Expert Solution
This question has been solved!
Explore an expertly crafted, step-by-step solution for a thorough understanding of key concepts.

Step by stepSolved in 2 steps with 1 images

Knowledge Booster

Similar questions
- Use the following table: $386 $328 $265 $428 $245 446 254 587 326 345 417 326 312 363 385 Prepare a frequency distribution from the above weekly salaries of teachers at Pikes Peak Community College. Use the following intervals: Salaries. Frequency $200 - $299.99. ?? 300 - 399.99. ?? 400 - 499.99. ?? 500 - 599.99. ??arrow_forwardUse the following table: $ 210 290 286 $ 505 480 410 $ 310 550 305 $ 380 490 $ 275 444 200 368 Prepare a frequency distribution from the above weekly salaries of teachers at Moore Community College. Use the following intervals: Salaries $200-$299.99 ces 300-399.99 400-499.99 500-599.99 Frequencyarrow_forwardHere is a set of data. 115 224 294 364 439 588 634 639 695 743 778 844 Identify the 5 number summary (min, Q1, median, Q3, max)arrow_forward
- please help. thank youarrow_forwardHere is a set of data. 66 105 119 230 240 365 456 507 620 704 742 871 944 964 Identify the 5 number summary (min, Q1, median, Q3, max)arrow_forwardConstruct a frequency distribution of the data collected. Use classes with the first class ranging from 51-60 55 70 80 85 90 100 55 75 80 85 90 100 60 75 85 85 90 100 60 80 85 90 95 100 65 80 85 90 95 100arrow_forward
- I) determine the number of classes ii) estimate the greatest and least frequencies. iii) determine the class width describe any patterns with the data.arrow_forwardConstruct a frequency distribution for the given data set using 6 classes. In the table, include the midpoints, relative frequencies, and cumulative frequencies. Which class has the greatest frequency and which has the least frequency? 269 258 331 447 408 358 Amount (in dollars) spent on books for a semester 84 482 511 430 508 446 158 50 485 269 412 395 95 304 403 87 405 381 320 245 473 87 315 C Complete the table, starting with the lowest class limit. Use the minimum data entry as the lower limit of the first class. (Type integers or decimals. Round the class limits to the nearest whole number. Round all other values to the nearest thousandth as needed.) Relative Cumulative Frequency Class 50-126 Frequency 75 Midpoint 88 Frequency 75 Clear all Check answerarrow_forwardThe weights (to the nearest five pounds) of 30 randomly selected male college students are organized in the histogram. Use the graph to find the median weight. The median weight is pounds. (Type an integer or a decimal.) C Students (frequency) Number 10- 8+ 6- 4- Weight of 30 Male College Students 110 115 120 125 130 135 140 145 150 155 160 165 Weight (pounds) ONarrow_forward
- The following data show the ages of recent award-winning male actors at the time when they won their award. Make a frequency table for the data, using bins of 20-29, 30-39, and so on. Click the icon to view the ages of male actors. Complete the table below. Age No. of actors Data Table 20-29 30-39 40-49 36 53 23 67 53 56 48 39 49 52 50-59 37 49 50 46 31 42 65 57 73 33 60-69 53 41 31 49 41 35 39 46 48 34 70-79 35 63 42 37 Print Donearrow_forwardConstruct a frequency distribution and a frequency histogram for the data set using the indicated number of classes. Describe any patterns. Number of classes: 8 Data set: Finishing timės (in seconds) of 20 male participants in a 5K race 1719 1634 1572 1475 2296 1446 1251 1803 1593 1778 1956 1525 1824 1617 1306 1822 2019 2082 1579 1478arrow_forwardFinish times (to the nearest hour) for 59 dogsled teams are shown below. Draw a relative-frequency histogram. Use five classes. 261 274 236 244 280 296 284 296 288 288 250 256 338 360 341 333 261 267 287 296 313 311 307 307 299 303 277 283 304 305 286 290 286 287 297 299 332 330 309 326 307 326 285 291 295 298 306 315 310 318 318 320 333 321 323 324 327 302 319 The frequency table for the above data is given below. Class Limits Boundaries Midpoint Freq. Relative Freq. Cumulative Freq. 236 – 260 235.5 – 260.5 248 4 0.07 4 261 – 285 260.5 – 285.5 273 9 0.15 13 286 – 310 285.5 – 310.5 298 26 0.44 39 311 – 335 310.5 – 335.5 323 17 0.29 56 336 – 360 335.5 – 360.5 348 3 0.05 59arrow_forward
arrow_back_ios
SEE MORE QUESTIONS
arrow_forward_ios
Recommended textbooks for you
- MATLAB: An Introduction with ApplicationsStatisticsISBN:9781119256830Author:Amos GilatPublisher:John Wiley & Sons Inc
 Probability and Statistics for Engineering and th...StatisticsISBN:9781305251809Author:Jay L. DevorePublisher:Cengage Learning
 Statistics for The Behavioral Sciences (MindTap C...StatisticsISBN:9781305504912Author:Frederick J Gravetter, Larry B. WallnauPublisher:Cengage Learning
  Elementary Statistics: Picturing the World (7th E...StatisticsISBN:9780134683416Author:Ron Larson, Betsy FarberPublisher:PEARSON
 The Basic Practice of StatisticsStatisticsISBN:9781319042578Author:David S. Moore, William I. Notz, Michael A. FlignerPublisher:W. H. Freeman
 Introduction to the Practice of StatisticsStatisticsISBN:9781319013387Author:David S. Moore, George P. McCabe, Bruce A. CraigPublisher:W. H. Freeman
MATLAB: An Introduction with Applications
Statistics
ISBN:9781119256830
Author:Amos Gilat
Publisher:John Wiley & Sons Inc
Probability and Statistics for Engineering and th...
Statistics
ISBN:9781305251809
Author:Jay L. Devore
Publisher:Cengage Learning
Statistics for The Behavioral Sciences (MindTap C...
Statistics
ISBN:9781305504912
Author:Frederick J Gravetter, Larry B. Wallnau
Publisher:Cengage Learning
Elementary Statistics: Picturing the World (7th E...
Statistics
ISBN:9780134683416
Author:Ron Larson, Betsy Farber
Publisher:PEARSON
The Basic Practice of Statistics
Statistics
ISBN:9781319042578
Author:David S. Moore, William I. Notz, Michael A. Fligner
Publisher:W. H. Freeman
Introduction to the Practice of Statistics
Statistics
ISBN:9781319013387
Author:David S. Moore, George P. McCabe, Bruce A. Craig
Publisher:W. H. Freeman