Construct a frequency polygon using the data. Choose the correct graph below. OA. OB. Oc. Frequency Frequency Frequency Age Does the graph suggest that the distribution is skewed? If so, how? O A. The distribution appears to be skewed to the left (or negatively skewed). O B. The distribution does not appear to be skewed Oc. The distribution appears to be skewed to the right (or positively skewed).
Construct a frequency polygon using the data. Choose the correct graph below. OA. OB. Oc. Frequency Frequency Frequency Age Does the graph suggest that the distribution is skewed? If so, how? O A. The distribution appears to be skewed to the left (or negatively skewed). O B. The distribution does not appear to be skewed Oc. The distribution appears to be skewed to the right (or positively skewed).

Glencoe Algebra 1, Student Edition, 9780079039897, 0079039898, 2018
18th Edition
ISBN:9780079039897
Author:Carter
Publisher:Carter
Chapter10: Statistics
Section10.6: Summarizing Categorical Data
Problem 23PPS

Related questions
Topic Video
Question
Thank you for your help
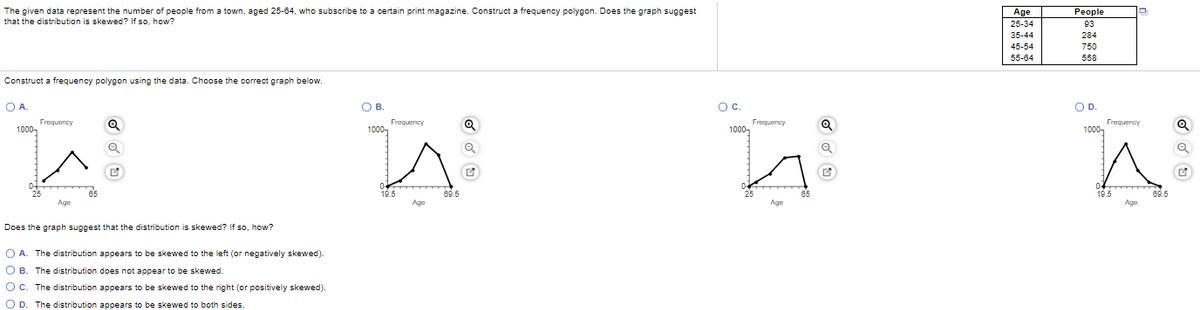
Transcribed Image Text:The given data represent the number of people from a town, aged 25-64, who subscribe to a certain print magazine. Construct a frequency polygon. Does the graph suggest
that the distribution is skewed? If so, how?
Age
People
25-34
93
35-44
284
45-54
750
55-64
558
Construct a frequency polygon using the data. Choose the correct graph below
OA.
OB.
Oc.
OD.
O D.
Frequency
Frequency
Frequency
Frequency
1000-
1000,
1000-
1000-
0-
19.5
04
19.5
65
69.5
25
65
69.5
Age
Age
Age
Age
Does the graph suggest that the distribution is skewed? If so, how?
O A. The distribution appears to be skewed to the left (or negatively skewed).
O B. The distribution does not appear to be skewed.
O c. The distribution appears to be skewed to the right (or positively skewed).
O D. The distribution appears to be skewed to both sides
Expert Solution
This question has been solved!
Explore an expertly crafted, step-by-step solution for a thorough understanding of key concepts.

This is a popular solution!

Trending now
This is a popular solution!

Step by step
Solved in 2 steps

Knowledge Booster


Learn more about
Need a deep-dive on the concept behind this application? Look no further. Learn more about this topic, statistics and related others by exploring similar questions and additional content below.Recommended textbooks for you
Glencoe Algebra 1, Student Edition, 9780079039897…
Algebra
ISBN:
9780079039897
Author:
Carter
Publisher:
McGraw Hill

Holt Mcdougal Larson Pre-algebra: Student Edition…
Algebra
ISBN:
9780547587776
Author:
HOLT MCDOUGAL
Publisher:
HOLT MCDOUGAL
Glencoe Algebra 1, Student Edition, 9780079039897…
Algebra
ISBN:
9780079039897
Author:
Carter
Publisher:
McGraw Hill
Holt Mcdougal Larson Pre-algebra: Student Edition…
Algebra
ISBN:
9780547587776
Author:
HOLT MCDOUGAL
Publisher:
HOLT MCDOUGAL