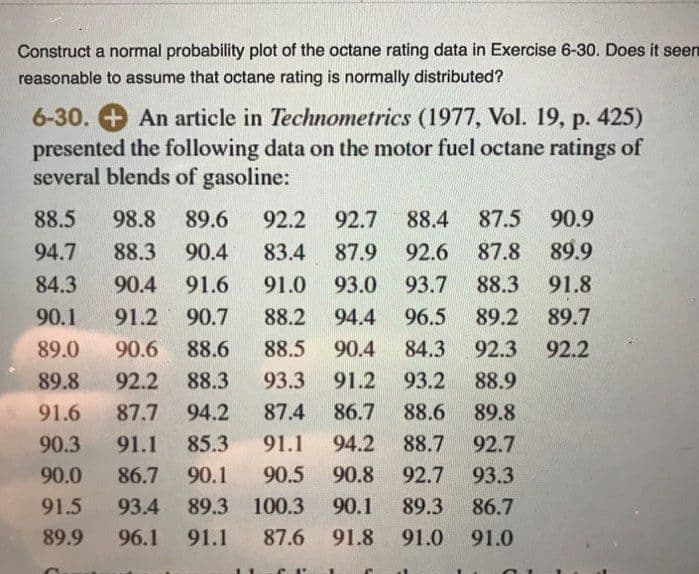
Construct a normal probability plot of the octane rating data in Exercise 6-30. Does it seen reasonable to assume that octane rating is normally distributed? 6-30. + An article in Technometrics (1977, Vol. 19, p. 425) presented the following data on the motor fuel octane ratings of several blends of gasoline: 88.5 98.8 89.6 92.2 92.7 88.4 87.5 90.9 94.7 88.3 90.4 83.4 87.9 92.6 87.8 89.9 84.3 90.4 91.6 91.0 93.0 93.7 88.3 91.8 90.1 91.2 90.7 88.2 94.4 96.5 89.2 89.7 89.0 90.6 88.6 88.5 90.4 84.3 92.3 92.2 89.8 92.2 88.3 93.3 91.2 93.2 88.9 91.6 87.7 94.2 87.4 86.7 88.6 89.8 90.3 91.1 85.3 91.1 94.2 88.7 92.7 90.0 86.7 90.1 90.5 90.8 92.7 93.3 91.5 93.4 89.3 100.3 90.1 89.3 86.7 89.9 96.1 91.1 87.6 91.8 91.0 91.0
Construct a normal probability plot of the octane rating data in Exercise 6-30. Does it seen reasonable to assume that octane rating is normally distributed? 6-30. + An article in Technometrics (1977, Vol. 19, p. 425) presented the following data on the motor fuel octane ratings of several blends of gasoline: 88.5 98.8 89.6 92.2 92.7 88.4 87.5 90.9 94.7 88.3 90.4 83.4 87.9 92.6 87.8 89.9 84.3 90.4 91.6 91.0 93.0 93.7 88.3 91.8 90.1 91.2 90.7 88.2 94.4 96.5 89.2 89.7 89.0 90.6 88.6 88.5 90.4 84.3 92.3 92.2 89.8 92.2 88.3 93.3 91.2 93.2 88.9 91.6 87.7 94.2 87.4 86.7 88.6 89.8 90.3 91.1 85.3 91.1 94.2 88.7 92.7 90.0 86.7 90.1 90.5 90.8 92.7 93.3 91.5 93.4 89.3 100.3 90.1 89.3 86.7 89.9 96.1 91.1 87.6 91.8 91.0 91.0

MATLAB: An Introduction with Applications
6th Edition
ISBN:9781119256830
Author:Amos Gilat
Publisher:Amos Gilat
Chapter1: Starting With Matlab
Section: Chapter Questions
Problem 1P

Related questions
Question
Transcribed Image Text:Construct a normal probability plot of the octane rating data in Exercise 6-30. Does it seen
reasonable to assume that octane rating is normally distributed?
6-30. + An article in Technometrics (1977, Vol. 19, p. 425)
presented the following data on the motor fuel octane ratings of
several blends of gasoline:
88.5
98.8
89.6
92.2
92.7
88.4
87.5
90.9
94.7
88.3
90.4
83.4
87.9
92.6
87.8
89.9
84.3
90.4
91.6
91.0
93.0
93.7
88.3
91.8
90.1
91.2
90.7
88.2
94.4
96.5
89.2
89.7
89.0
90.6
88.6
88.5
90.4
84.3
92.3
92.2
89.8
92.2
88.3
93.3
91.2
93.2
88.9
91.6 87.7
94.2
87.4
86.7
88.6
89.8
90.3
91.1
85.3 91.1 94.2
88.7
92.7
90.0
86.7
90.1
90.5 90.8
92.7
93.3
91.5
93.4
89.3 100.3 90.1
89.3
86.7
89.9
96.1
91.1
87.6 91.8
91.0 91.0
Expert Solution
This question has been solved!
Explore an expertly crafted, step-by-step solution for a thorough understanding of key concepts.

This is a popular solution!

Trending now
This is a popular solution!

Step by step
Solved in 2 steps with 2 images

Recommended textbooks for you
MATLAB: An Introduction with Applications
Statistics
ISBN:
9781119256830
Author:
Amos Gilat
Publisher:
John Wiley & Sons Inc

Probability and Statistics for Engineering and th…
Statistics
ISBN:
9781305251809
Author:
Jay L. Devore
Publisher:
Cengage Learning

Statistics for The Behavioral Sciences (MindTap C…
Statistics
ISBN:
9781305504912
Author:
Frederick J Gravetter, Larry B. Wallnau
Publisher:
Cengage Learning
MATLAB: An Introduction with Applications
Statistics
ISBN:
9781119256830
Author:
Amos Gilat
Publisher:
John Wiley & Sons Inc
Probability and Statistics for Engineering and th…
Statistics
ISBN:
9781305251809
Author:
Jay L. Devore
Publisher:
Cengage Learning
Statistics for The Behavioral Sciences (MindTap C…
Statistics
ISBN:
9781305504912
Author:
Frederick J Gravetter, Larry B. Wallnau
Publisher:
Cengage Learning

Elementary Statistics: Picturing the World (7th E…
Statistics
ISBN:
9780134683416
Author:
Ron Larson, Betsy Farber
Publisher:
PEARSON

The Basic Practice of Statistics
Statistics
ISBN:
9781319042578
Author:
David S. Moore, William I. Notz, Michael A. Fligner
Publisher:
W. H. Freeman

Introduction to the Practice of Statistics
Statistics
ISBN:
9781319013387
Author:
David S. Moore, George P. McCabe, Bruce A. Craig
Publisher:
W. H. Freeman