Construct a residual plot. 16- 16 16- 16- 12 12 12 12 8. 8- 8 8- 4 4 4 4 -4 -4- -4 -4 .. -8 -8 -8 -8- -12 -12 -12 -12 -16 -16 -16 -16- 6 8 4 6 8 6 8 2 4 10 12 14 2 4 6 10 12 14 10 12 14 4 10 12 14 Years of Experience Years of Experience Years of Experience Years of Experience Do the assumptions about the error terms seem reasonable in light of the residual plot? O The plot suggests a funnel pattern in the residuals indicating that the error term assumptions appear reasonable. O The plot suggests a generally horizontal band of residual points indicating that the error term assumptions do not appear reasonable. O The plot suggests curvature in the residuals indicating that the error term assumptions appear reasonable. O The plot suggests a generally horizontal band of residual points indicating that the error term assumptions appear reasonable. O The plot suggests a funnel pattern in the residuals indicating that the error term assumptions do not appear reasonable Residuals Residuals
Construct a residual plot. 16- 16 16- 16- 12 12 12 12 8. 8- 8 8- 4 4 4 4 -4 -4- -4 -4 .. -8 -8 -8 -8- -12 -12 -12 -12 -16 -16 -16 -16- 6 8 4 6 8 6 8 2 4 10 12 14 2 4 6 10 12 14 10 12 14 4 10 12 14 Years of Experience Years of Experience Years of Experience Years of Experience Do the assumptions about the error terms seem reasonable in light of the residual plot? O The plot suggests a funnel pattern in the residuals indicating that the error term assumptions appear reasonable. O The plot suggests a generally horizontal band of residual points indicating that the error term assumptions do not appear reasonable. O The plot suggests curvature in the residuals indicating that the error term assumptions appear reasonable. O The plot suggests a generally horizontal band of residual points indicating that the error term assumptions appear reasonable. O The plot suggests a funnel pattern in the residuals indicating that the error term assumptions do not appear reasonable Residuals Residuals

Chapter4: Linear Functions
Section: Chapter Questions
Problem 30PT: For the following exercises, use Table 4 which shows the percent of unemployed persons 25 years or...

Related questions
Question
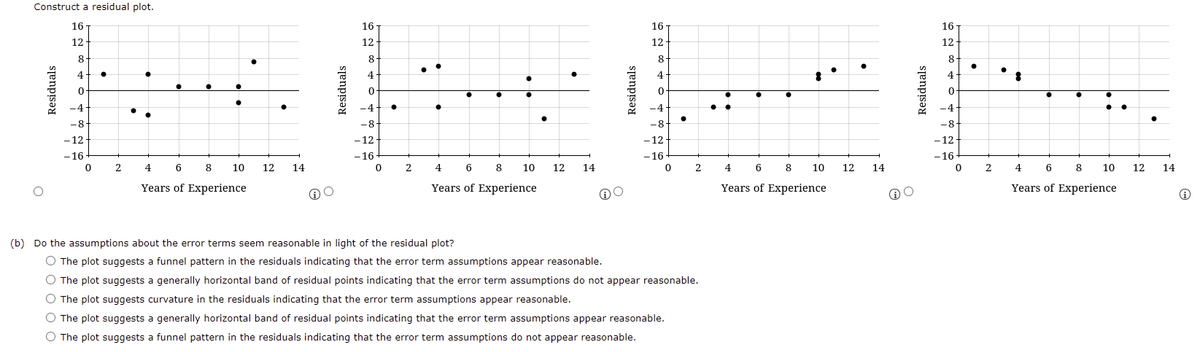
Transcribed Image Text:Construct a residual plot.
16
16
16
16
12
12-
12-
12
8.
8.
8
8
-
4-
4
4
4
-4
-4.
-4
-4
-8-
-8+
-8-
-8+
- 12
- 12
-12
-12
- 16
- 16
- 16
-16
2
4
8
10
12
14
2
4
6 8
10
12
14
2
4
6
8
10
12
14
2
4
6
8
10
12
14
Years of Experience
Years of Experience
Years of Experience
Years of Experience
(b) Do the assumptions about the error terms seem reasonable in light of the residual plot?
O The plot suggests a funnel pattern in the residuals indicating that the error term assumptions appear reasonable.
O The plot suggests a generally horizontal band of residual points indicating that the error term assumptions do not appear reasonable.
O The plot suggests curvature in the residuals indicating that the error term assumptions appear reasonable.
O The plot suggests a generally horizontal band of residual points indicating that the error term assumptions appear reasonable.
O The plot suggests a funnel pattern in the residuals indicating that the error term assumptions do not appear reasonable.
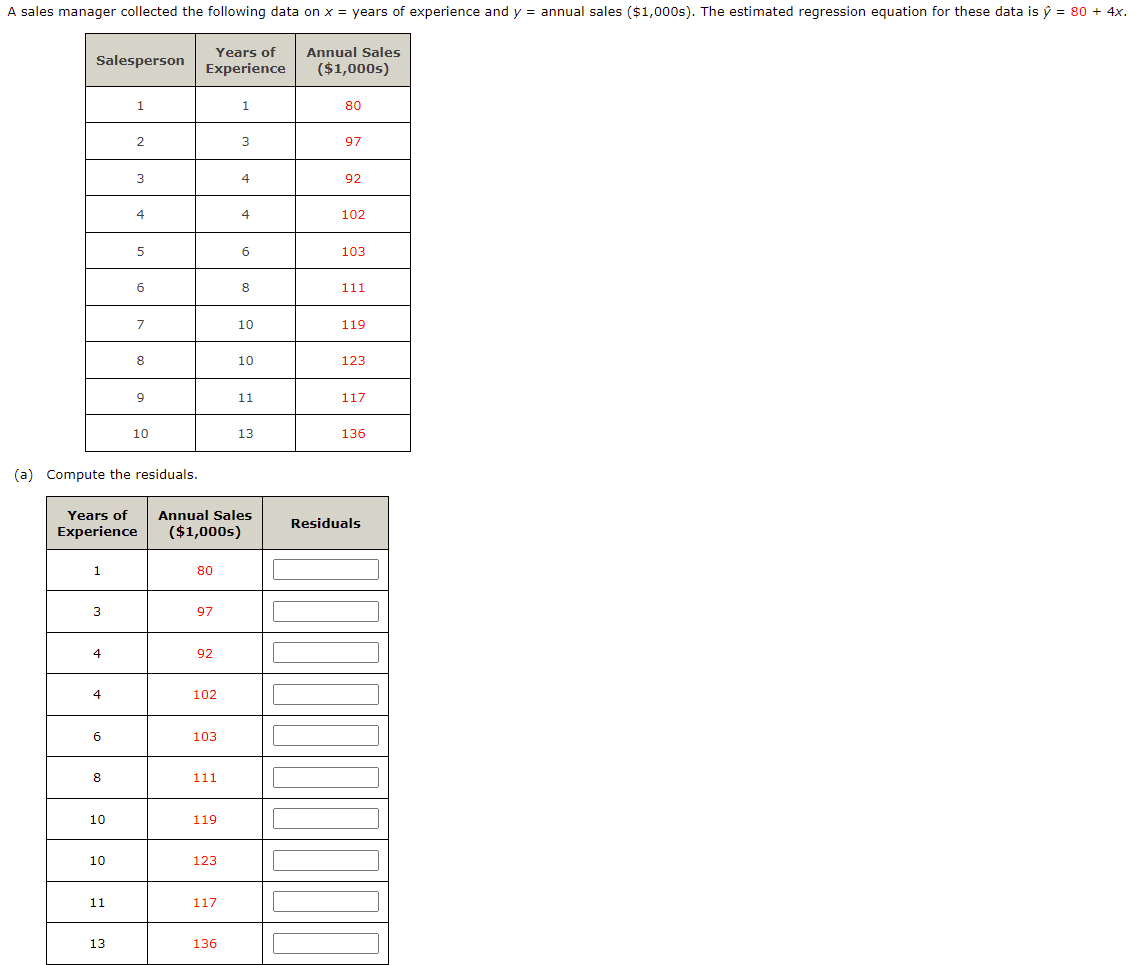
Transcribed Image Text:A sales manager collected the following data on x = years of experience and y = annual sales ($1,000s). The estimated regression equation for these data is ý = 80 + 4x.
Years of
Annual Sales
Salesperson
Experience
($1,000s)
1
1
80
3
97
3
4
92
4
4
102
103
6
8
111
7
10
119
8
10
123
9
11
117
10
13
136
(a) Compute the residuals.
Years of
Annual Sales
Residuals
Experience
($1,000s)
1
80
97
4
92
4
102
6
103
8
111
10
119
10
123
11
117
13
136
Expert Solution
This question has been solved!
Explore an expertly crafted, step-by-step solution for a thorough understanding of key concepts.

This is a popular solution!

Trending now
This is a popular solution!

Step by step
Solved in 2 steps with 1 images

Recommended textbooks for you

Functions and Change: A Modeling Approach to Coll…
Algebra
ISBN:
9781337111348
Author:
Bruce Crauder, Benny Evans, Alan Noell
Publisher:
Cengage Learning

College Algebra
Algebra
ISBN:
9781305115545
Author:
James Stewart, Lothar Redlin, Saleem Watson
Publisher:
Cengage Learning
Functions and Change: A Modeling Approach to Coll…
Algebra
ISBN:
9781337111348
Author:
Bruce Crauder, Benny Evans, Alan Noell
Publisher:
Cengage Learning
College Algebra
Algebra
ISBN:
9781305115545
Author:
James Stewart, Lothar Redlin, Saleem Watson
Publisher:
Cengage Learning

Algebra and Trigonometry (MindTap Course List)
Algebra
ISBN:
9781305071742
Author:
James Stewart, Lothar Redlin, Saleem Watson
Publisher:
Cengage Learning