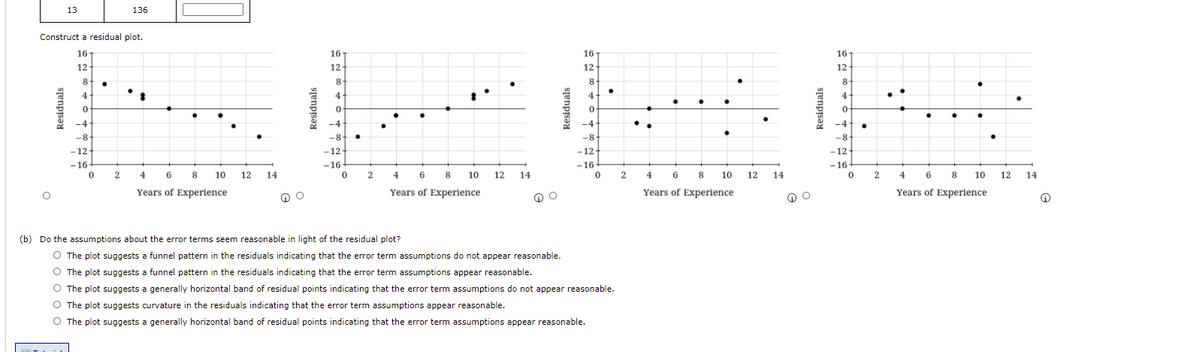
Construct a residual plot. EEBE 167 16 167 167 12 12 12 12 8 4 -4 -4 -4 %3. -4 -8 -8 -8. -8 -12 -12 -12 -12 -16 -16 -16 -16 4 6 8 10 12 14 6 8 10 12 14 6 8 10 12 14 4 6 8 10 12 14 4 Years of Experience Years of Experience Years of Experience Years of Experience O Do the assumptions about the error terms seem reasonable in light of the residual plot? O The plot suggests a funnel pattern in the residuals indicating that the error term assumptions do not appear reasonable. O The plot suggests a funnel pattern in the residuals indicating that the error term assumptions appear reasonable. O The plot suggests a generally horizontal band of residual points indicating that the error term assumptions do not appear reasonable. O The plot suggests curvature in the residuals indicating that the error term assumptions appear reasonable. O The plot suggests a generally horizontal band of residual points indicating that the error term assumptions appear reasonable.

Glencoe Algebra 1, Student Edition, 9780079039897, 0079039898, 2018
18th Edition
ISBN:9780079039897
Author:Carter
Publisher:Carter
Chapter4: Equations Of Linear Functions
Section4.6: Regression And Median-fit Lines
Problem 6PPS
icon
Related questions
icon
Concept explainers
Topic Video
Question
13
136
Construct a residual plot.
16
16
16
16
12
12
12-
12
8.
8
8-
8
4
4
4
4
-4
-4
-4
-4
-8-
-8-
-12-
-8
-8
-12
-12
-12
-16
-16
-16
-16
o 2 4 6 8 10
0 2 4 6 8 10
0 2
0 2
12
14
12
14
4 6 8 10
12
14
4 6 8
10
12
14
Years of Experience
Years of Experience
Years of Experience
Years of Experience
(b) Do the assumptions about the error terms seem reasonable in light of the residual plot?
O The plot suggests a funnel pattern in the residuals indicating that the error term assumptions do not appear reasonable.
O The plot suggests a funnel pattern in the residuals indicating that the error term assumptions appear reasonable.
O The plot suggests a generally horizontal band of residual points indicating that the error term assumptions do not appear reasonable.
O The plot suggests curvature in the residuals indicating that the error term assumptions appear reasonable.
O The plot suggests a generally horizontal band of residual points indicating that the error term assumptions appear reasonable.
Transcribed Image Text:13 136 Construct a residual plot. 16 16 16 16 12 12 12- 12 8. 8 8- 8 4 4 4 4 -4 -4 -4 -4 -8- -8- -12- -8 -8 -12 -12 -12 -16 -16 -16 -16 o 2 4 6 8 10 0 2 4 6 8 10 0 2 0 2 12 14 12 14 4 6 8 10 12 14 4 6 8 10 12 14 Years of Experience Years of Experience Years of Experience Years of Experience (b) Do the assumptions about the error terms seem reasonable in light of the residual plot? O The plot suggests a funnel pattern in the residuals indicating that the error term assumptions do not appear reasonable. O The plot suggests a funnel pattern in the residuals indicating that the error term assumptions appear reasonable. O The plot suggests a generally horizontal band of residual points indicating that the error term assumptions do not appear reasonable. O The plot suggests curvature in the residuals indicating that the error term assumptions appear reasonable. O The plot suggests a generally horizontal band of residual points indicating that the error term assumptions appear reasonable.
A statistical program is recommended.
A sales manager collected the following data on x = years of experience and y = annual sales ($1,000s). The estimated regression equation for these data is ý = 81 + 4x.
Years of
Annual Sales
($1,000s)
Salesperson
Experience
1
80
2
3
97
3
4
97
4
102
6
103
8
111
7
10
119
8
10
128
11
117
10
13
136
(a) Compute the residuals.
Annual Sales
($1,000s)
Years of
Residuals
Experience
80
3
97
4
97
4
102
6
103
8
111
10
119
10
128
11
117
13
136
Construct a residual plot.
Transcribed Image Text:A statistical program is recommended. A sales manager collected the following data on x = years of experience and y = annual sales ($1,000s). The estimated regression equation for these data is ý = 81 + 4x. Years of Annual Sales ($1,000s) Salesperson Experience 1 80 2 3 97 3 4 97 4 102 6 103 8 111 7 10 119 8 10 128 11 117 10 13 136 (a) Compute the residuals. Annual Sales ($1,000s) Years of Residuals Experience 80 3 97 4 97 4 102 6 103 8 111 10 119 10 128 11 117 13 136 Construct a residual plot.
Expert Solution
steps

Step by step

Solved in 2 steps with 1 images

Blurred answer
Knowledge Booster
Centre, Spread, and Shape of a Distribution
Learn more about
Need a deep-dive on the concept behind this application? Look no further. Learn more about this topic, statistics and related others by exploring similar questions and additional content below.
Similar questions
Recommended textbooks for you
Glencoe Algebra 1, Student Edition, 9780079039897…
Algebra
ISBN:
9780079039897
Author:
Carter
Publisher:
McGraw Hill
College Algebra
College Algebra
Algebra
ISBN:
9781938168383
Author:
Jay Abramson
Publisher:
OpenStax
College Algebra
College Algebra
Algebra
ISBN:
9781337282291
Author:
Ron Larson
Publisher:
Cengage Learning
Functions and Change: A Modeling Approach to Coll…
Algebra
ISBN:
9781337111348
Author:
Bruce Crauder, Benny Evans, Alan Noell
Publisher:
Cengage Learning
College Algebra
College Algebra
Algebra
ISBN:
9781305115545
Author:
James Stewart, Lothar Redlin, Saleem Watson
Publisher:
Cengage Learning
Algebra and Trigonometry (MindTap Course List)
Algebra
ISBN:
9781305071742
Author:
James Stewart, Lothar Redlin, Saleem Watson
Publisher:
Cengage Learning