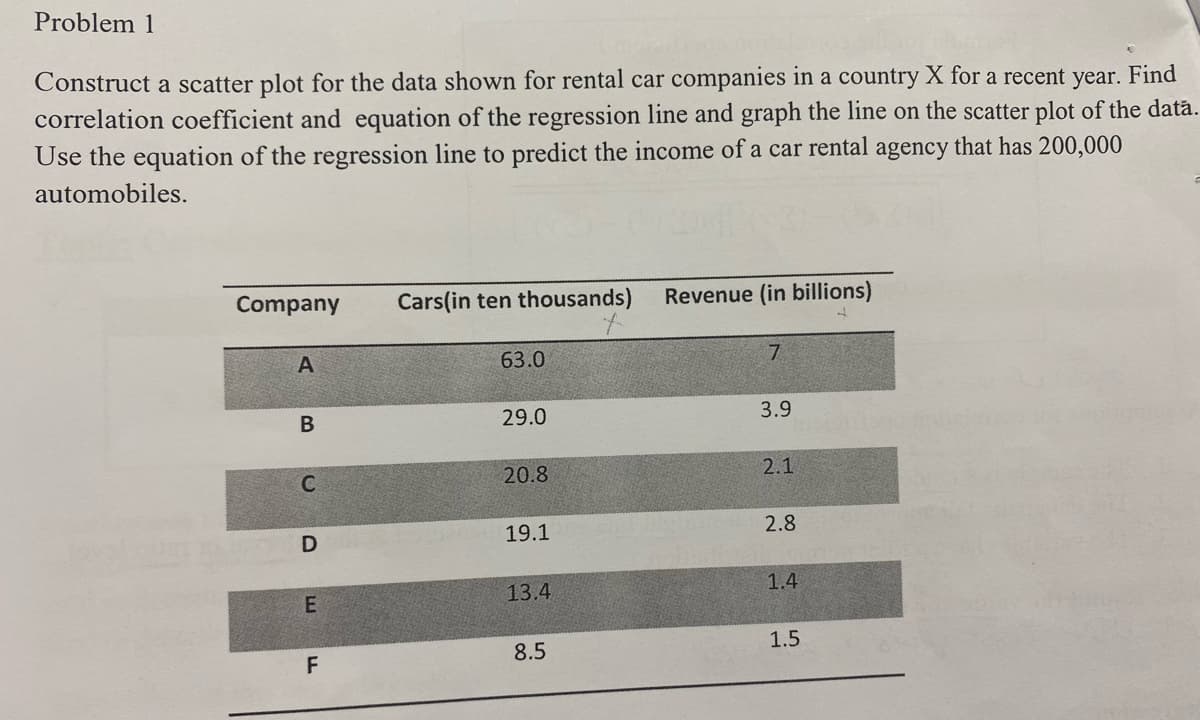
Construct a scatter plot for the data shown for rental car companies in a country X for a recent year. Find correlation coefficient and equation of the regression line and graph the line on the scatter plot of the data. Use the equation of the regression line to predict the income of a car rental agency that has 200,000 automobiles. Company Cars(in ten thousands) Revenue (in billions) 63.0 29.0 3.9 B 2.1 20.8 C 2.8 19.1 1.4 13.4 1.5 8.5
Q: The data in the chart shows the maximum and corresponding resting heart rate of a healthy 20-year…
A:
Q: Find the equation of the regression line for the given data. Then construct a scatter plot of the…
A: From excel output the regression equation can be obtained as: Thus, the equation is
Q: A finance manager employed by an automobile dealership believes that the number of cars sold in his…
A: Apart from interest rate charged, there can be many factors that finance manager should consider in…
Q: Find the equation of the regression line for the given data. Then construct a scatter plot of the…
A: Note: Hi there! Thank you for posting the question. As there are several independent questions,…
Q: Find the equation of the regression line for the given data. Then construct a scatter plot of the…
A: Hey, since there are multiple subparts posted, we will answer first three questions. If you want any…
Q: Find the equation of the regression line for the given data. Then construct a scatter plot of the…
A: Given data : Sr no X Y 1 778 51 2 621 47 3 519 46 4 510 42 5 494 39 6 473 38…
Q: Find the equation of the regression line for the given data. Then construct a scatter plot of the…
A: Use EXCEL to determine the regression equation. EXCEL procedure: Go to EXCEL Go to Data>Data…
Q: Find the equation of the regression line for the given data. Then construct a scatter plot of the…
A: The data given for x and y variable is as follows x y 758 51 621 47 518 46 510 43 492…
Q: A study was made by a retail merchant to determine the relation between weekly advertising…
A: The independent variable is advertising costs. The dependent variable is sales. This is simple…
Q: The data in the chart shows the maximum and corresponding resting heart rate of a healthy 20-year…
A:
Q: Find the equation of the regression line for the given data. Then construct a scatter plot of the…
A: 1) Software procedure for regression in EXCEL. Enter the given data in EXCEL sheet. Go to Data >…
Q: Amelia plays basketball for her high school. She wants to improve to play at the college level. She…
A: X denotes the number of hours Amelia practices jump shot and Y denotes the scores scored by her.…
Q: The data show the chest size and weight of several bears. Find the regression equation, letting…
A: Given data, X Y X*Y X*X 58 414 24012 3364 50 312 15600 2500 65 499 32435 4225 59 450…
Q: Find the equation of the regression line for the given data. Then construct a scatter plot of the…
A: Use EXCEL to determine the regression equation. EXCEL procedure: Go to EXCEL Go to Data>Data…
Q: Find the equation of the regression line for the given data. Then construct a scatter plot of the…
A:
Q: Find the equation of the regression line for the given data. Then construct a scatter plot of the…
A: Step-by-step procedure to draw scatterplot using MINITAB software:Choose Graph > Scatter…
Q: Find the equation of the regression line for the given data. Then construct a scatter plot of the…
A: Given data, X Y X*Y X*X 762 51 38862 580644 621 46 28566 385641 515 45 23175 265225 508…
Q: Find the equation of the regression line for the given data. Then construct a scatter plot of the…
A:
Q: find the (a) explained variation, (b) unexplained variation, and (c) indicated prediction interval.…
A: The data shows the amounts of court income (thousands of dollars) and salaries (thousands of…
Q: Using your favorite statistics software package, you generate a scatter plot with a regression…
A: Given data, y=59.31x+26.22 r=0.161 proportion of the variation in y=?
Q: Find the equation of the regression line for the given data. Then construct a scatter plot of the…
A: Use the Excel and Perform the Regression. Followings are the Steps to perform the Regression 1) Open…
Q: 5. Application a) Create a scatter plot of time spent watching television versus number of books…
A: Answer:5
Q: A study was made by a retail merchant to determine the relation between weekly advertising…
A:
Q: Find the equation of the regression line for the given data. Then construct a scatter plot of the…
A: Given data is Height x 766 620 520 508 494 484 stories y 51 46 45 43 39 35
Q: A study was made by a retail merchant to determine the relation between weekly advertising…
A: Dependent variable, y : Advertising costs Independent variable, x : Sales Given data : x y 40…
Q: Find the equation of the regression line for the given data. Then construct a scatter plot of the…
A: Regression Equation: Excel Procedure: Enter X and Y in Excel>Data>Data Analysis>…
Q: Find the equation of the regression line for the given data. Then construct a scatter plot of the…
A: Introduction: Consider that x is the independent variable and y is the dependent variable. The size…
Q: Q1. Age and pulse rate on a study of 6 people is as follows. Age 1 5 Pulse 130 10 15 20 25 110 100…
A:
Q: Find the equation of the regression line for the given data. Then construct a scatter plot of the…
A:
Q: Find the equation of the regression line for the given data. Then construct a scatter plot of the…
A:
Q: Find the equation of the regression line for the given data. Then construct a scatter plot of the…
A: The least square regression line is given by, ŷ = bx+a Where b=…
Q: Find the equation of the regression line for the given data. Then construct a scatter plot of the…
A: The following data values shows the heights (in feet) and the number of stories of six notable…
Q: A finance manager employed by an automobile dealership believes that the number of cars sold in his…
A: From the result of Regression, Coefficient of determination is 0.997738. It tells that 99.77398 %…
Q: Find the equation of the regression line for the given data. Then construct a scatter plot of the…
A: For the given data find regression equation
Q: Find the equation of the regression line for the given data. Then construct a scatter plot of the…
A: The following data has been provided: Height (x) stories (y) 774 51 625 47 521 45 508 41…
Q: Find the equation of the regression line for the given data. Then construct a scatter plot of the…
A: The sums are, x y x2 xy 766 51 586756 39066 620 46 384400 28520 520 44 270400 22880 508…
Q: Find the equation of the regression line for the given data. Then construct a scatter plot of the…
A:
Q: Use the value of the linear correlation coefficient to calculate the coefficient of determination.…
A: Given : Correlation coefficient = r = 0.926
Q: Find the equation of the regression line for the given data. Then construct a scatter plot of the…
A: In this case Height (x) is the independent variable and stories (y) is the dependent variable. Enter…
Q: Find the equation of the regression line for the given data. Then construct a scatter plot of the…
A:
Q: Find the equation of the regression line for the given data. Then construct a scatter plot of the…
A: Given data is Height, x 766 620 520 508 494 484 Stories, y 51 46 44 43 39 36
Q: Let x be the weight of a car (in hundreds of pounds), and let y be the miles per gallon (mpg).…
A:
Q: cafe company wants to determine how the money they spend on Google ads impacts their monthly…
A: As per our guidelines, we are allowed to answer first three sub-parts only. Thanks Given Data : l…
Q: A study is conducted to determine the relationship between a driver’s age and the number of…
A: From given data, X Y X*Y X*X Y*Y 16 3 48 256 9 24 2 48 576 4 18 5 90 324 25 17 2 34 289 4…
Q: Find the equation of the regression line for the given data. Then construct a scatter plot of the…
A:
Q: The following scatterplot shows the relationship between x and y in a simple linear regression…
A:
Q: Find the equation of the regression line for the given data. Then construct a scatter plot of the…
A: Software procedure for regression in EXCEL. Enter the given data in EXCEL sheet. Go to Data >…
Q: Find the equation of the regression line for the given data. Then construct a scatter plot of the…
A:
Q: Find the equation of the regression line for the given data. Then construct a scatter plot of the…
A: Regression equation is given by,
Q: Find the equation of the regression line for the given data. Then construct a scatter plot of the…
A:
Trending now
This is a popular solution!
Step by step
Solved in 3 steps with 1 images
- Find the equation of the regression line for the following data set. x 1 2 3 y 0 3 4Olympic Pole Vault The graph in Figure 7 indicates that in recent years the winning Olympic men’s pole vault height has fallen below the value predicted by the regression line in Example 2. This might have occurred because when the pole vault was a new event there was much room for improvement in vaulters’ performances, whereas now even the best training can produce only incremental advances. Let’s see whether concentrating on more recent results gives a better predictor of future records. (a) Use the data in Table 2 (page 176) to complete the table of winning pole vault heights shown in the margin. (Note that we are using x=0 to correspond to the year 1972, where this restricted data set begins.) (b) Find the regression line for the data in part ‚(a). (c) Plot the data and the regression line on the same axes. Does the regression line seem to provide a good model for the data? (d) What does the regression line predict as the winning pole vault height for the 2012 Olympics? Compare this predicted value to the actual 2012 winning height of 5.97 m, as described on page 177. Has this new regression line provided a better prediction than the line in Example 2?Problem 2 The following printout shows the results of a simple linear regression model that predicts monthly sales (in thousands of dollars) based on how much money was spent on advertising (in thousands of dollars) during a particular month for 15 stores of a retail chain. a) Is there a statistically significant relationship between money spent on advertising and sales? Test at the 5% level of significance and explain your approach (including hypotheses). b) Somebody claims that every additional $1,000 in advertising will increase sales by more than $2,000 in the population. Can you find support for this claim given the results of your analysis? Test at the 5% level of significance and explain your approach (including hypotheses). How is this test different from the one in part a)? c) Find a 95% confidence interval for the change in sales given a $1,000 increase in the amount of money spent on advertising. How does this confidence interval relate to your answer to part a)?
- Problem 2: You have to examine the relationship between the age and price for used cars sold in the last year by a car dealership company to build a predictive linear regression model. The age of the car is the independent variable for your model. Here is the table of the data: Car Age in Years Price in Dollars 4 6,300 4 5,800 5 5,700 5 4,500 7 4,500 7 4,200 8 4,100 9 3,100 10 2,100 11 2,500 12 2,200 What would we expect for the price of an 8.5 year-old car?Problem:1 A) Crazy Dave, a well-known baseball analyst, wants to determine which variables are important in predicting a team’s wins in a given season. He has collected data related to wins, earned run average (ERA), and runs scored for the 2009 season (stored BB2009). Develop a model to predict the number of wins based on ERA and runs scored. State the multiple regression equation. Interpret the meaning of the slopes in this equation. Predict the number of wins for a team that has an ERA of 4.50 and has scored 750 runs. Perform a residual analysis on the results and determine Is there a significant relationship between number of wins and the two independent variables (ERA and runs scored) at the 0.05 level of significance? Determine the p-value in (e) and interpret its meaning. Interpret the meaning of the coefficient of multiple determination in this problem. At the 0.05 level of significance, determine whether each independent variable makes a significant contribution to the…QUESTION 2 XXX Electric Illuminating Company is doing a survey on the relationship between electricity used in kilowatt-hours (thousand) and the number of rooms in a private single-family residence. A random sample of 10 homes was selected and the electricity consumption recorded as below. ii. Find a suitable linear regression equation ? = ? + ??. iii. Determine the number of kilowatt-hours (thousand) for an eleven-room residence.
- Suppose that in a certain neighborhood, the cost of a home is proportional to the size of the home in square feet. If the regression equation quantifying this relationship is found to be (cost) = 94.872*(size) + 612.216, what does the slope indicate? Question 21 options: 1) When cost increases by 1 dollar, size increases by 94.872 square feet. 2) We are not given the dataset, so we cannot make an interpretation. 3) When size increases by 1 square foot, cost increases by 612.216 dollars. 4) When cost increases by 1 dollar, size increases by 612.216 square feet. 5) When size increases by 1 square foot, cost increases by 94.872 dollars.Question 4: A company studied the productivity of their employees on a new information system. They were interested in if the age (X) of data entry operators influenced the number of completed entries made per hour (Y). If the regression equation is = 14.374 + 0.145x. The SD of age is = 14.04, and the SD of the number of completed entries made per hour is = 2.61. What is the correlation coefficient between age and productivity? How to interpret the correlation? How to interpret the slope? If a data entry operator is 40 years old, what is the predict productivity using the regression equation?PROBLEM :The amount spent on medical expenses per day is correlated with other health factors for 5 adult males. A study came up with the following table: Medical Amount spentcost for alcohol Weight Age2100 200 185 502378 250 200 421657 100 175 372584 200 225 542658 250 220 32 Which of the following factors has a significant effect on medical expenses? Create the regression equation for the problem.
- Question 3. Calculate and interpret the regression line for the data.question 26 What is the relationship between the number of minutes per day a woman spends talking on the phone and the woman's weight? The time on the phone and weight for 8 women are shown in the table below. Time 54 88 82 61 39 40 84 83 Pounds 149 198 184 166 142 140 170 163 The equation of the linear regression line is: ˆyy^ = ?+ x (Please show your answers to 3 decimal places) Use the model to predict the weight of a woman who spends 50 minutes on the phone.Weight = ? (Please round your answer to the nearest whole number.) Interpret the slope of the regression line in the context of the question: For every additional minute women spend on the phone, they tend to weigh on averge 0.87 additional pounds. As x goes up, y goes up. The slope has no practical meaning since you cannot predict a women's weight. Interpret the y-intercept in the context of the question: The y-intercept has no practical meaning for this study. The average woman's weight is…If you know that the equation for the simple linear regression between the final exam result and the mid-year examination result for students in the engineering statistics subject is as follows final exam: 50+0.5 x. midterm The regression coefficient is?