Find the equation of the regression line for the given data. Then construct a scatter plot of the data and draw the regression line. (The pair of variables have a significant correlation.) Then use the regression equation to predict the value of y for each of the given x-values, if meaningful. The table below shows the heights (in feet) and the number of stories of six notable buildings in a city. 625 520 510 492 Height, x Stories, y 764 55 484 35 (a) x=499 feet (c)x=315 feet (b)x=650 feet (d) x=732 feet 47 45 42 37 Find the regression equation. y=x+ (Round the slope to three decimal places as needed. Round the y-intercept to two decimal places as needed.) Choose the correct graph below. OA. OB. O D. Q ++ Hot Q Height (feet) (a) Predict the value of y for x=499. Choose the correct answer below. OA. 39 OB. 49 OC. 54 O D. not meaningful A) PR 60- 04 0 800 60+ 0 Height (feet) 800 O C. 60+ 800 0 Height (feet) 60+ 0 Height (feet) 800
Find the equation of the regression line for the given data. Then construct a scatter plot of the data and draw the regression line. (The pair of variables have a significant correlation.) Then use the regression equation to predict the value of y for each of the given x-values, if meaningful. The table below shows the heights (in feet) and the number of stories of six notable buildings in a city. 625 520 510 492 Height, x Stories, y 764 55 484 35 (a) x=499 feet (c)x=315 feet (b)x=650 feet (d) x=732 feet 47 45 42 37 Find the regression equation. y=x+ (Round the slope to three decimal places as needed. Round the y-intercept to two decimal places as needed.) Choose the correct graph below. OA. OB. O D. Q ++ Hot Q Height (feet) (a) Predict the value of y for x=499. Choose the correct answer below. OA. 39 OB. 49 OC. 54 O D. not meaningful A) PR 60- 04 0 800 60+ 0 Height (feet) 800 O C. 60+ 800 0 Height (feet) 60+ 0 Height (feet) 800

Functions and Change: A Modeling Approach to College Algebra (MindTap Course List)
6th Edition
ISBN:9781337111348
Author:Bruce Crauder, Benny Evans, Alan Noell
Publisher:Bruce Crauder, Benny Evans, Alan Noell
Chapter3: Straight Lines And Linear Functions
Section3.CR: Chapter Review Exercises
Problem 15CR: Life Expectancy The following table shows the average life expectancy, in years, of a child born in...

Related questions
Question
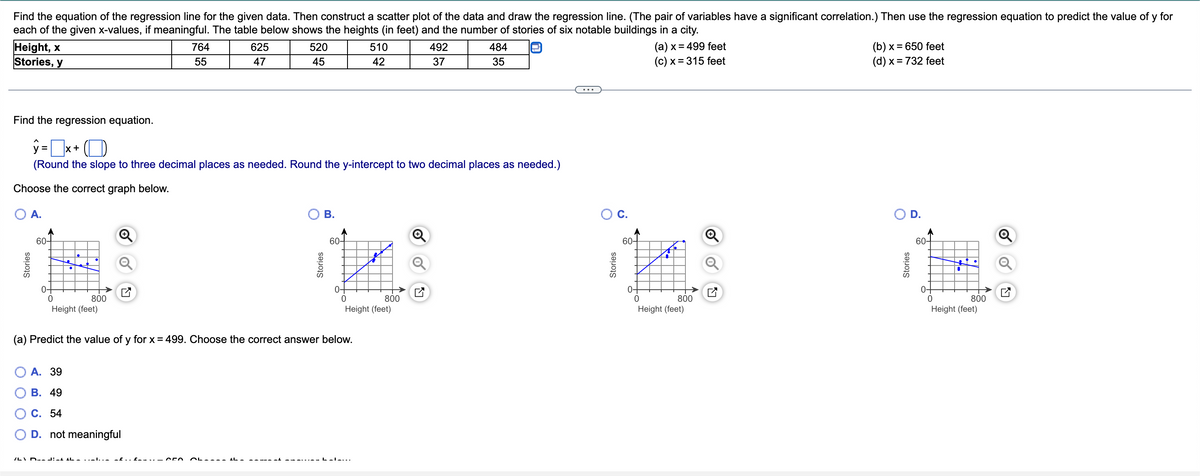
Transcribed Image Text:Find the equation of the regression line for the given data. Then construct a scatter plot of the data and draw the regression line. (The pair of variables have a significant correlation.) Then use the regression equation to predict the value of y for
each of the given x-values, if meaningful. The table below shows the heights (in feet) and the number of stories of six notable buildings in a city.
625
520
510
492
484
Height, x
Stories, y
764
55
(a) x = 499 feet
(c) x = 315 feet
(b) x = 650 feet
(d) x = 732 feet
47
45
42
37
35
Find the regression equation.
ŷ = x +
(Round the slope to three decimal places as needed. Round the y-intercept to two decimal places as needed.)
Choose the correct graph below.
A.
B.
D.
Q
Height (feet)
(a) Predict the value of y for x = 499. Choose the correct answer below.
A. 39
B. 49
C. 54
D. not meaningful
CEO OL
Stories
60-
800
/L) D-dind th. . .– I. . -
Stories
60-
0-
800
Height (feet)
O C.
Stories
60-
++
•
0
Height (feet)
800
N
Stories
60-
800
Height (feet)
2
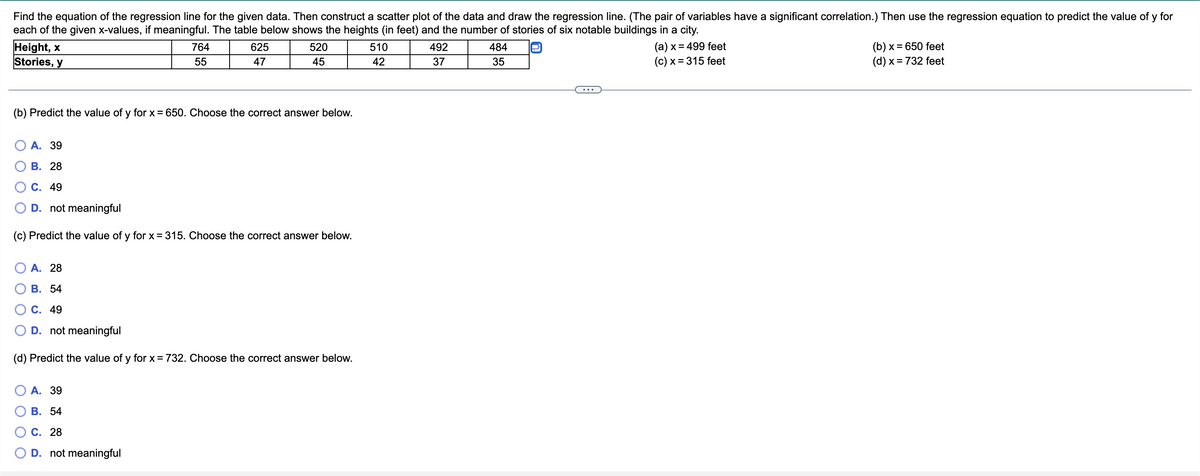
Transcribed Image Text:Find the equation of the regression line for the given data. Then construct a scatter plot of the data and draw the regression line. (The pair of variables have a significant correlation.) Then use the regression equation to predict the value of y for
each of the given x-values, if meaningful. The table below shows the heights (in feet) and the number of stories of six notable buildings in a city.
Height, x
764
625
520
510
492
484
(a) x = 499 feet
(b) x = 650 feet
Stories, y
55
47
45
42
37
35
(c) x = 315 feet
(d) x = 732 feet
(b) Predict the value of y for x = 650. Choose the correct answer below.
A. 39
B. 28
C. 49
D. not meaningful
(c) Predict the value of y for x = 315. Choose the correct answer below.
A. 28
B. 54
C. 49
D. not meaningful
(d) Predict the value of y for x = 732. Choose the correct answer below.
A. 39
B. 54
C. 28
D. not meaningful
Expert Solution
This question has been solved!
Explore an expertly crafted, step-by-step solution for a thorough understanding of key concepts.

This is a popular solution!

Trending now
This is a popular solution!

Step by step
Solved in 2 steps with 3 images

Recommended textbooks for you
Functions and Change: A Modeling Approach to Coll…
Algebra
ISBN:
9781337111348
Author:
Bruce Crauder, Benny Evans, Alan Noell
Publisher:
Cengage Learning

Glencoe Algebra 1, Student Edition, 9780079039897…
Algebra
ISBN:
9780079039897
Author:
Carter
Publisher:
McGraw Hill

College Algebra
Algebra
ISBN:
9781305115545
Author:
James Stewart, Lothar Redlin, Saleem Watson
Publisher:
Cengage Learning
Functions and Change: A Modeling Approach to Coll…
Algebra
ISBN:
9781337111348
Author:
Bruce Crauder, Benny Evans, Alan Noell
Publisher:
Cengage Learning
Glencoe Algebra 1, Student Edition, 9780079039897…
Algebra
ISBN:
9780079039897
Author:
Carter
Publisher:
McGraw Hill
College Algebra
Algebra
ISBN:
9781305115545
Author:
James Stewart, Lothar Redlin, Saleem Watson
Publisher:
Cengage Learning

Elementary Linear Algebra (MindTap Course List)
Algebra
ISBN:
9781305658004
Author:
Ron Larson
Publisher:
Cengage Learning

Algebra and Trigonometry (MindTap Course List)
Algebra
ISBN:
9781305071742
Author:
James Stewart, Lothar Redlin, Saleem Watson
Publisher:
Cengage Learning
