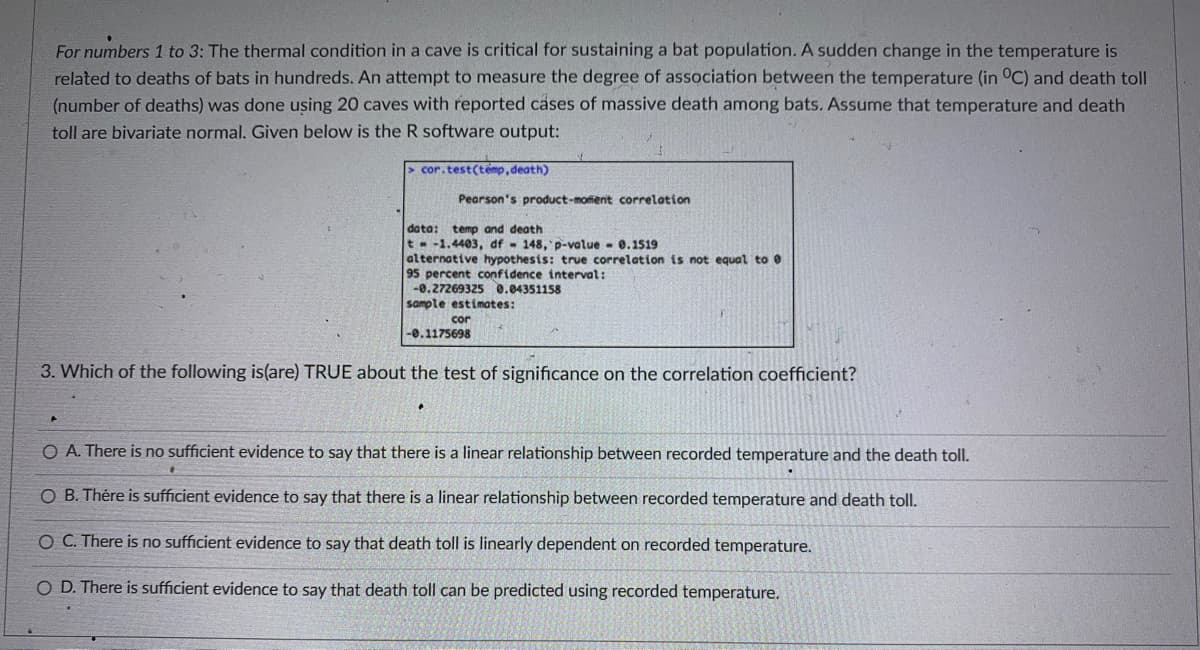
For numbers 1 to 3: The thermal condition in a cave is critical for sustaining a bat population. A sudden change in the temperature is related to deaths of bats in hundreds. An attempt to measure the degree of association between the temperature (in °C) and death toll (number of deaths) was done using 20 caves with reported cases of massive death among bats. Assume that temperature and death toll are bivariate normal. Given below is the R software output: > cor.test(temp, death) Pearson's product-moffent correlation data: temp and death t- -1.4403, df 148, p-value - 0.1519 alternative hypothesis: true correlation is not equal to 0 95 percent confidence interval: -0.27269325 0.04351158 sample estimates: cor -0.1175698 3. Which of the following is(are) TRUE about the test of significance on the correlation coefficient? O A. There is no sufficient evidence to say that there is a linear relationship between recorded temperature and the death toll. O B. Thére is sufficient evidence to say that there is a linear relationship between recorded temperature and death toll. O C. There is no sufficient evidence to say that death toll is linearly dependent on recorded temperature. O D. There is sufficient evidence to say that death toll can be predicted using recorded temperature.
For numbers 1 to 3: The thermal condition in a cave is critical for sustaining a bat population. A sudden change in the temperature is related to deaths of bats in hundreds. An attempt to measure the degree of association between the temperature (in °C) and death toll (number of deaths) was done using 20 caves with reported cases of massive death among bats. Assume that temperature and death toll are bivariate normal. Given below is the R software output: > cor.test(temp, death) Pearson's product-moffent correlation data: temp and death t- -1.4403, df 148, p-value - 0.1519 alternative hypothesis: true correlation is not equal to 0 95 percent confidence interval: -0.27269325 0.04351158 sample estimates: cor -0.1175698 3. Which of the following is(are) TRUE about the test of significance on the correlation coefficient? O A. There is no sufficient evidence to say that there is a linear relationship between recorded temperature and the death toll. O B. Thére is sufficient evidence to say that there is a linear relationship between recorded temperature and death toll. O C. There is no sufficient evidence to say that death toll is linearly dependent on recorded temperature. O D. There is sufficient evidence to say that death toll can be predicted using recorded temperature.

MATLAB: An Introduction with Applications
6th Edition
ISBN:9781119256830
Author:Amos Gilat
Publisher:Amos Gilat
Chapter1: Starting With Matlab
Section: Chapter Questions
Problem 1P

Related questions
Question
3
Transcribed Image Text:For numbers 1 to 3: The thermal condition in a cave is critical for sustaining a bat population. A sudden change in the temperature is
related to deaths of bats in hundreds. An attempt to measure the degree of association between the temperature (in °C) and death toll
(number of deaths) was done using 20 caves with reported cases of massive death among bats. Assume that temperature and death
toll are bivariate normal. Given below is the R software output:
> cor.test(temp, death)
Pearson's product-moffent correlation
data:
t- -1.4403, df 148, p-value - 0.1519
alternative hypothesis: true correlation is not equal to 0
95 percent confidence interval:
-0.27269325 0.04351158
sample estimates:
temp and death
cor
-0.1175698
3. Which of the following is(are) TRUE about the test of significance on the correlation coefficient?
O A. There is no sufficient evidence to say that there is a linear relationship between recorded temperature and the death toll.
O B. Thére is sufficient evidence to say that there is a linear relationship between recorded temperature and death toll.
O C. There is no sufficient evidence to say that death toll is linearly dependent on recorded temperature.
O D. There is sufficient evidence to say that death toll can be predicted using recorded temperature.
Expert Solution
This question has been solved!
Explore an expertly crafted, step-by-step solution for a thorough understanding of key concepts.

Step by step
Solved in 2 steps

Recommended textbooks for you
MATLAB: An Introduction with Applications
Statistics
ISBN:
9781119256830
Author:
Amos Gilat
Publisher:
John Wiley & Sons Inc

Probability and Statistics for Engineering and th…
Statistics
ISBN:
9781305251809
Author:
Jay L. Devore
Publisher:
Cengage Learning

Statistics for The Behavioral Sciences (MindTap C…
Statistics
ISBN:
9781305504912
Author:
Frederick J Gravetter, Larry B. Wallnau
Publisher:
Cengage Learning
MATLAB: An Introduction with Applications
Statistics
ISBN:
9781119256830
Author:
Amos Gilat
Publisher:
John Wiley & Sons Inc
Probability and Statistics for Engineering and th…
Statistics
ISBN:
9781305251809
Author:
Jay L. Devore
Publisher:
Cengage Learning
Statistics for The Behavioral Sciences (MindTap C…
Statistics
ISBN:
9781305504912
Author:
Frederick J Gravetter, Larry B. Wallnau
Publisher:
Cengage Learning

Elementary Statistics: Picturing the World (7th E…
Statistics
ISBN:
9780134683416
Author:
Ron Larson, Betsy Farber
Publisher:
PEARSON

The Basic Practice of Statistics
Statistics
ISBN:
9781319042578
Author:
David S. Moore, William I. Notz, Michael A. Fligner
Publisher:
W. H. Freeman

Introduction to the Practice of Statistics
Statistics
ISBN:
9781319013387
Author:
David S. Moore, George P. McCabe, Bruce A. Craig
Publisher:
W. H. Freeman