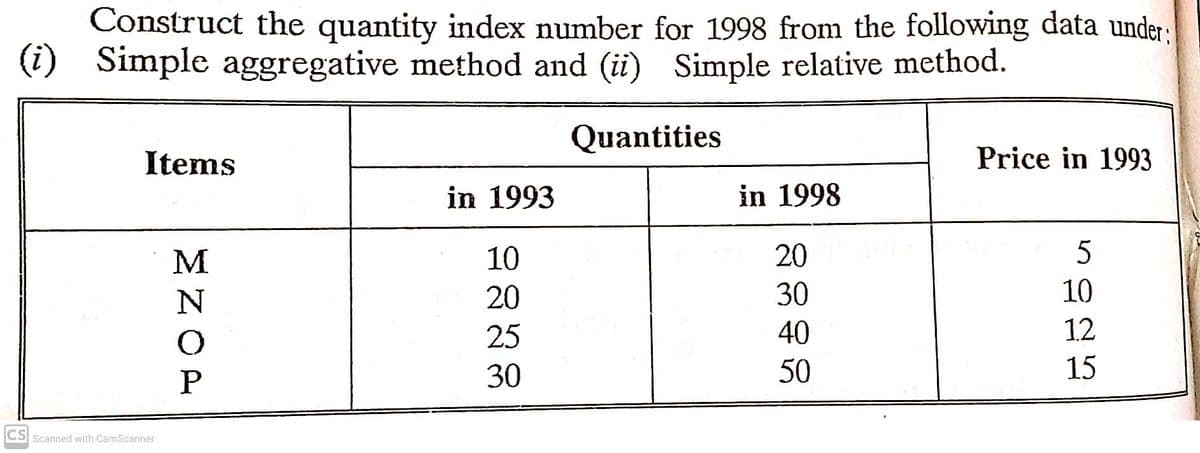
Construct the quantity index number for 1998 from the following data under: (i) Simple aggregative method and (ii) Simple relative method. Quantities Items Price in 1993 in 1993 in 1998 M 10 20 20 30 10 25 40 12 30 50 15


Q: 6.28 Prenatal vitamins and Autism. Researchers studying the link between prenatal vitamin use and…
A:
Q: Source DF SS MS F P Treatment 4 1010.56 ? 29.84 ? Block ? ? 64.765 ? ? Error 20 169.33 ?…
A:
Q: Consider the following probability distribution. What is the probability that Y is not less than 2?…
A: Given that Probability distribution. Y 0 1 2 3 4 5 P(Y) 0.009 0.376 0.371 0.167 0.061 0.016
Q: Suppose you have to construct a 98% confidence interval for a 10-sample study, what is the…
A:
Q: random from hospital records and invited to participate in the study. Each participant's daily…
A: If we want to compare three or more groups mean, then One way anova is used. It is used to determine…
Q: compute (16*113.8-74.8*22+20-6)/10.3333 on excel. give the answer to 5 decimal places
A: Excel Microsoft Excel is a spreadsheet-based data analysis and visualization application that uses…
Q: what is the probability of drawing a score at random from a normal distribution with a mean of…
A: Given , The random variable (X) follows normal distribution. Mean = μ = 101.99 Standard deviation =…
Q: The following are the resultof the survey made by the quality control department in a certain…
A: “Since you have posted a question with multiple sub-parts, we will solve the first three subparts…
Q: 1. Use the counting principle to determine the number of elements in the sample space.The possible…
A: The multiplication principle states that if a task is completed in multiple steps, then the number…
Q: 2) Is the proportion of women at StatCrunchU equal to the proportion of men at StatCrunchU?…
A: Introduction: Denote p as the true proportion of females at the university.
Q: Two cards are drawn from a standard deck of cards. Find the probability that the first card is…
A: Answer - Two cards are drawn from a standard deck of cards. Find the probability that…
Q: For the given confidence level and values of x and n, find the following. x= 46, n=96, confidence…
A: Given,n=96 , x=46α=1-0.95=0.05α2=0.025Z0.025=1.96 (from Z-table)
Q: What is the mean and the standard deviation of the sampling distribution of the sample mean
A: We have given that the population has mean 120 and standard deviation is 10. The sample size is…
Q: What is the 95% confidence interval for the mean number of hours spent by senior high school…
A:
Q: Answer only the 2 questions
A: Given
Q: From the following data compute Laspeyre's Index number for 1998 : Price Quantity Items 1995 . 1998…
A:
Q: 3. Assuming that you wished to have the highest possible score on an exam relative to other scores;…
A:
Q: The amount of time a doctor spends with each patient is exponentially distributed with a mean of 8…
A: From the given information, The amount of time a doctor spends with each patient is exponentially…
Q: If the random variable x has a Poisson Distribution with mean μ = 3.95, find the probability that x…
A:
Q: The additional growth of plants in one week are recorded for 11 plants with a sample standard…
A: Given that Number of plants (n) = 11 Sample standard deviation (s) = 4 inches Sample mean (x¯) = 12…
Q: Match each scatterplot shown below with one of the four specified correlations. a. 0.38 b. -0.90 c.…
A: The best suited possible values for the coefficient of correlation are to be assigned to the…
Q: The accompanying data file shows the square footage and associated property taxes for 20 homes in an…
A: Given data indicates the square footage and associated property taxes for 20 homes in an affluent…
Q: It gives a range of values within which the parameter value possibly falls. Interval Sampling O b.…
A: “Since you have asked multiple questions, we will solve the first question for you. If you want any…
Q: 80 85 75 76 81 76 75 76 76 96 89 74 74 76 86 74 90 75 88 79 88 85 95 92 92 87 87 93 94 94 90 85 75…
A: Frequency distribution table : A frequency distribution table is one approach to organize data to…
Q: A fair six - sided die is rolled.Find The odd number is: b.2. multiple of 3 b.3. multiple of 5 b.4.…
A: Given: A fair six-sided die is rolled. The possible outcomes are : {1,2,3,4,5,6} n(S) = 6
Q: You are interested in estimating the the mean lifespan of a cell phone. From past data, you estimate…
A:
Q: nction that assighs a Peal P random experiment. O a. dependent variable O b. Independent varaible O…
A: The given question is about identify the variable.
Q: 4. In a survey of 80 students, 33 liked watching anime, 18 enjoyed watching both anime and kdrama,…
A: We create Venn diagram for the above situation.
Q: A process has mean of u= 25 and o=5. A sample size of 5 is taken to control the process using…
A: Note: As per the guidelines, in case of multiple subparts, answer to first three subparts will be…
Q: 3. A bank in Ottawa is considering a survey of its customers for the purpose of estimating the mean…
A: The 90% confidence interval for the population mean number of checks written per customer per month,…
Q: A recent study investigated whether cell phone users experience separation anxiety when they cannot…
A: cell phone no cell phone 100 154 101 129 93 129 101 71 87 128 120 123 142 126 115…
Q: Question: A local bank claims that the waiting time for its customers to be served is the lowest in…
A: Given Information: Local Bank: Sample size n1=15 Sample mean x¯1=5.3 Sample standard deviation…
Q: The average time to run the 5K fun run is 24 minutes and the standard deviation is 2.7 minutes. 40…
A: As per Bartleby guideline expert have to answer first three subparts only dear student please upload…
Q: Find the value of the binomial coefficient, n = 28, x = 3. You may use your calculator or MS Excel.…
A: The objective is to find out the value of the binomial coefficient when n = 28, x = 3
Q: The table below shows the color and the model of cars purchased by 160 randomly selected customers…
A: Hypothesis testing : Hypothesis testing is a type of statistical inference that uses sample data to…
Q: A bank operates both a drive-up facility and a walk-up window. On a randomly selected day, let X be…
A: Probability : Probability is a field of mathematics that deals with numerical descriptions of how…
Q: Let X and Y be independent v.a with uniform distribution on the interval (0, 20) and (0, 30)…
A:
Q: VII. Given the binomial experiment with n = 100 rials and probability of success on a single trial p…
A:
Q: what proportion of the standard normal distribution lies below -1.38999? Please use excel for all…
A: The Excel formula to find the proportion of the standard normal distribution lies below z is,
Q: A hospital is trying to cut down on emergency room wait times. It is interested in the amount of…
A: We have given that the sample mean 1.5 hours and sample standard deviation s is 0.5 hours. The…
Q: Figure Spifference for each of the following studies. N2 20 (a) (b) (C) (d) (e) 5 40 60 20 60 30 30…
A: Given Differences between N1 S21 N2 S22
Q: Takes data from a sample and makes inferences (i.e., draw conclusions, make predictions, make…
A: Inferential statistics: It is the procedure whereby inferences (draw conclusion, make predictions,…
Q: Q1. A private agency claims that the special crash program it offers significantly increases the…
A:
Q: 3. For two independent events, A and B, P(A)=D0.1 and P(B)-D0.5. Enter your probabilities as…
A:
Q: s published that 45% of college seniors want to learn more sbout ere is no differene een before aud…
A: Given: Sample size, n=65 No. of seniors want to learn more about financial literacy, x=35
Q: Construct the sampling distribution of the sample mean for the following population and with the…
A:
Q: ly select 14 student cars and find they have a mean age of 7.3 years and a standard deviation of 3.6…
A: Given Test statistic =1.62 ,n1=14, n2=18
Q: The following statements are properties of t-distribution EXCEPT
A:
Q: Which of the following statements is TRUE? O a The larger the size of the sample, the greater is the…
A: 1) Sample size and confidence interval relation. We know that Confidence interval (CI) = x¯±Zcxσn…
Q: To investigate the relation between hair color and eye color, the hair color and eye color of 5383…
A: Note: It has not been specified which variable is X and which is Y. So, it is assumed that Eye color…

Step by step
Solved in 2 steps with 2 images

- The following data is given for Soweto Hospital with regards to the number of patients admitted in the first half of the year ended 30 June 2023 and the total costs incurred by the hospital to treat these patients in this period:MonthNumber of patients admittedTotal costs incurred by the hospital (Rands)January20050 000February20050 000March25055 000April25055 000May30060 000June15045 000Required:Calculate the variable cost per unit and total fixed costs by using the Least Squares (Simple Regression Analysis) method.***Only do this question using Minitab and be sure to show images and steps used*** Using Minitab and Interpreting Results cpafirm.csv (data for minitab): amount0.001.200.431.001.470.830.503.341.581.46-0.36-1.102.600.000.00-1.700.831.990.001.34 Medlin and Associates is a regional certified public accounting (CPA) firm located near Minneapolis. Recently, a team conducted an audit for a discount chain. One part of the audit involved developing anestimate for the mean dollar error in total charges that occurs during the checkout process. The firm wishes to develop a 95% confidence interval estimate for the population mean. The data cpaf irm.csvcan be read into Minitab. Note that positive values indicate that the customer was overcharged. Your statistics instructor claims that 60 percent of the students who take her Elementary Statistics class go through life feeling more enriched. For some reason that she can’t quite figure out, mostpeople don’t believe her. You decide to check this…The following data represent the monthly phone use, in minutes, of a customer enrolled in a fraud prevention program for the past 20 months. The phone company decides to use the upper fence as the cutoff point for the number of minutes at which the customer should be contacted. What is the cutoff point? 510398398515357327480491308408483394320338463321374307538409
- The following data represent the square footage of 10 three-bedroom condos for sale in Hilton Head, South Carolina. 1,559 ------ 1,625 ------ 1,167 ------ 1,264 ------ 1,676 ------ 1,300 ------ 2,058 ------ 1,126 ------ 1,858 ------ 1,321 Determine the interquartile range for this sample. Are there any outliers in this data set?Jensen Tire & Auto is in the process of deciding whether to purchase a maintenance contract for its new computer wheel alignment and balancing machine. Managers feel that maintenance expense should be related to usage, and they collected the following information on weekly usage (hours) and annual maintenance expense (in hundreds of dollars).The following data has been collected on the interarrival times of patients to an emergency department: 3.772, 1.761, 0.743, 15.988, 0.412, 7.541, 6.900, 3.447, 7.024, 1.061, 5.449, 0.309, 0.766, 4.807, 8.143, 0.093, 9.524, 0.012, 4.634, and 0.195 minutes. Estimate the squared coefficient of variation of the arrival process. Is the arrival process likely to be Poisson? Why or why not? Estimate the arrival rate?
- For unemployed persons in the United States, the average number of months ofunemployment at the end of December 2009 was approximately seven months(Bureau of Labor Statistics, January 2010). Suppose the following data are for aparticular region in upstate New York. The values in the first column show thenumber of months unemployed and the values in the second column show thecorresponding number of unemployed persons.MonthsUnemployedNumberUnemployed1 10292 16863 22694 26755 34876 46527 41458 35879 2325 10 1120Let x be a random variable indicating the number of months a person is unemployed.a. Use the data to develop an empirical discrete probability distribution for x.b. Show that your probability distribution satisfies the conditions for a validdiscrete probability distribution.c. What is the probability that a person is unemployed for two months or less?Unemployed for more than two months?d. What is the probability that a person is unemployed for more than sixmonths?The following are the drying times (minutes) of 100sheets coated with polyurethane under various ambientconditions:45.6 50.3 55.1 63.0 58.2 65.5 51.1 57.4 60.4 54.956.1 62.1 43.5 63.8 64.9 59.9 63.0 67.7 53.8 57.961.8 52.2 61.2 51.6 58.6 73.8 53.9 64.1 57.2 75.455.9 70.1 46.2 63.6 56.0 48.1 62.2 58.8 50.8 68.151.4 73.9 66.7 42.9 71.0 56.1 60.8 58.6 70.6 62.259.9 47.5 72.5 62.0 56.8 54.3 61.0 66.3 52.6 63.564.3 63.6 53.5 55.1 62.8 63.3 64.7 54.9 54.4 69.664.2 59.3 60.6 57.1 68.3 46.7 73.7 56.8 62.9 58.468.5 68.9 62.1 62.8 74.4 43.8 40.0 64.4 50.8 49.955.8 66.8 67.0 64.8 57.6 68.3 42.5 64.4 48.3 56.5Construct a frequency distribution of these data, usingeight classes.Is the number of games won by a major league baseball team in a season related to the team batting average? The table below shows the number of games won and the batting average (in thousandths) of 8 teams. Team Games Won Batting Average 1 9797 269269 2 9595 275275 3 8686 273273 4 9999 261261 5 6464 285285 6 118118 260260 7 8787 274274 8 8888 280280 Using games won as the explanatory variable ?x, compute the correlation coefficient
- Is the number of games won by a major league baseball team in a season related to the team batting average? The table below shows the number of games won and the batting average (in thousandths) of 8 teams. Team Games Won Batting Average 1 8383 289289 2 116116 290290 3 101101 287287 4 8181 262262 5 110110 288288 6 119119 269269 7 6060 268268 8 6161 280280 Using games won as the explanatory variable xx, do the following: (a) The correlation coefficient is r=r= . (b) The equation of the least squares line is y^=y^=The United States Census Bureau provided the following estimates and predic- tions for the total world population (* data from 2012, 2020-2050 numbers are predictions). Year Population 1950 2,556,518,868 1960 3,040,617,514 1970 3,707,921,742 1980 4,447,068,714 1990 5,274,320,491 2000 6,073,265,234 2010 6,838,220,183 2020* 7,608,075,253 2030* 8,295,925,812 2040* 8,897,180,403 2050* 9,404,296,384 Two major models used in predicting population growths are the Exponential Model P(t) = P0ert and the Logistic Model P(t) = k1 + be−ct Let t = 0 represent the year 1950 and plot the given dataset in a graph with viewing dimensions [−10, 110] for the x-coordinate and [0, 1010] for the y-coordinate. 1 In a paragraph discuss the properties of both models, then explain why one of the models fits the dataset better. Things you should touch upon in your explanations include but are not limited to: Assumptions being made by the model on the dataset, The behavior of the model with respect to the…In a sample of 300 days, St. Petersburg has 171foggy days. In an independent sample of 200 days,Stockholm has 92 foggy days. Compute the 95% CIfor the difference between the two populationproportions of foggy days.


