The table below shows the color and the model of cars purchased by 160 randomly selected customers at a car dealership in 2020. Model Color Тоyota Hyundai Red 17 19 White 25 35 black 35 29 Use a 5 percent level of significance to test the null hypothesis that color chosen and car mode are independent. i. State the null and alternative hypotheses for this test. ii. Calculate: a. the expected frequency for red vehicle and the Toyota model b. the chis-square contribution, x 2 , for red vehicle and the Toyota model
The table below shows the color and the model of cars purchased by 160 randomly selected customers at a car dealership in 2020. Model Color Тоyota Hyundai Red 17 19 White 25 35 black 35 29 Use a 5 percent level of significance to test the null hypothesis that color chosen and car mode are independent. i. State the null and alternative hypotheses for this test. ii. Calculate: a. the expected frequency for red vehicle and the Toyota model b. the chis-square contribution, x 2 , for red vehicle and the Toyota model

MATLAB: An Introduction with Applications
6th Edition
ISBN:9781119256830
Author:Amos Gilat
Publisher:Amos Gilat
Chapter1: Starting With Matlab
Section: Chapter Questions
Problem 1P

Related questions
Question
Transcribed Image Text:8:57 A A •
* 71%i
Stats Question three.docx
Not saved yet
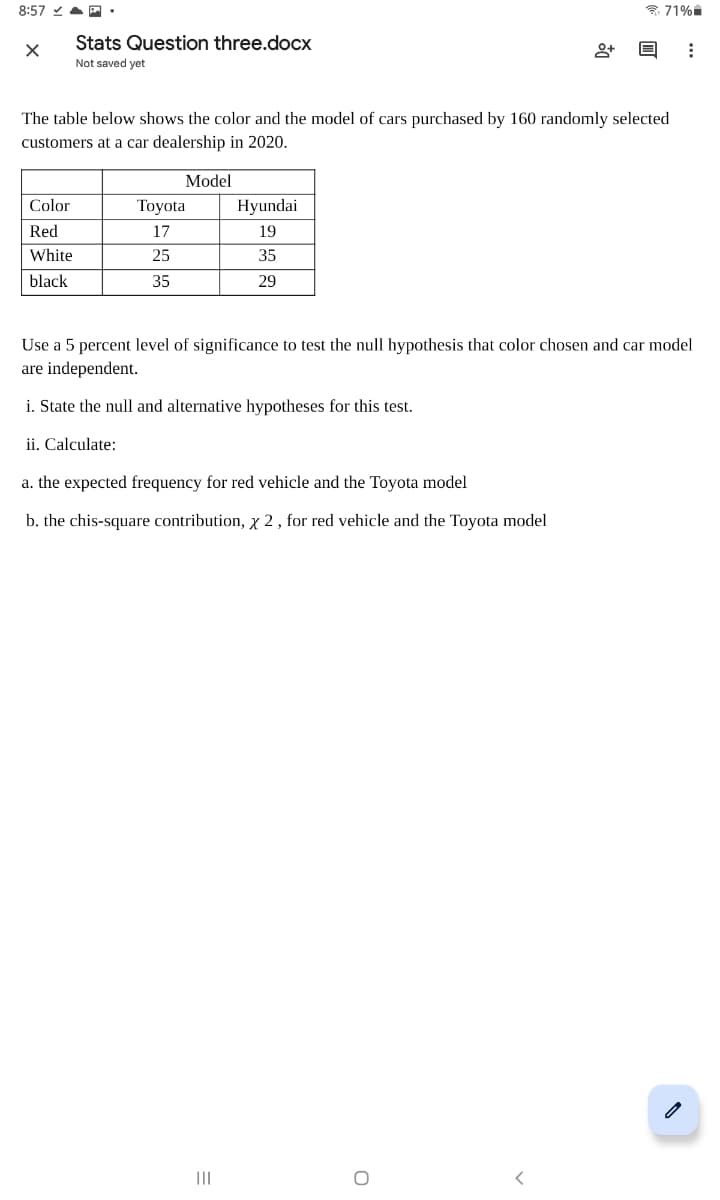
The table below shows the color and the model of cars purchased by 160 randomly selected
customers at a car dealership in 2020.
Model
Color
Тoyota
Hyundai
Red
17
19
White
25
35
black
35
29
Use a 5 percent level of significance to test the null hypothesis that color chosen and car model
are independent.
i. State the null and alternative hypotheses for this test.
ii. Calculate:
a. the expected frequency for red vehicle and the Toyota model
b. the chis-square contribution, x 2, for red vehicle and the Toyota model
Expert Solution
This question has been solved!
Explore an expertly crafted, step-by-step solution for a thorough understanding of key concepts.

Step by step
Solved in 2 steps with 1 images

Recommended textbooks for you
MATLAB: An Introduction with Applications
Statistics
ISBN:
9781119256830
Author:
Amos Gilat
Publisher:
John Wiley & Sons Inc

Probability and Statistics for Engineering and th…
Statistics
ISBN:
9781305251809
Author:
Jay L. Devore
Publisher:
Cengage Learning

Statistics for The Behavioral Sciences (MindTap C…
Statistics
ISBN:
9781305504912
Author:
Frederick J Gravetter, Larry B. Wallnau
Publisher:
Cengage Learning
MATLAB: An Introduction with Applications
Statistics
ISBN:
9781119256830
Author:
Amos Gilat
Publisher:
John Wiley & Sons Inc
Probability and Statistics for Engineering and th…
Statistics
ISBN:
9781305251809
Author:
Jay L. Devore
Publisher:
Cengage Learning
Statistics for The Behavioral Sciences (MindTap C…
Statistics
ISBN:
9781305504912
Author:
Frederick J Gravetter, Larry B. Wallnau
Publisher:
Cengage Learning

Elementary Statistics: Picturing the World (7th E…
Statistics
ISBN:
9780134683416
Author:
Ron Larson, Betsy Farber
Publisher:
PEARSON

The Basic Practice of Statistics
Statistics
ISBN:
9781319042578
Author:
David S. Moore, William I. Notz, Michael A. Fligner
Publisher:
W. H. Freeman

Introduction to the Practice of Statistics
Statistics
ISBN:
9781319013387
Author:
David S. Moore, George P. McCabe, Bruce A. Craig
Publisher:
W. H. Freeman