cortisol_level” of excel file  “exer3_data.xlsx”. R outputs can be found in the file “exer3_outputs.pdf” 4. Suppose they conducted another set of experiment with increased sample size and saw that the three feed additives have different mean cortisol level. Table below showed summary of Tukey’s HSD. Summarize the result of Tukey’s HSD in Table 2 and provide synthesis.  Table 1. Matrix of HSD’s test result for the experiment Treatments Mean difference p-value A2-A1 -0.8960 0.00154 A3-A1 -0.9040 0.00129 A3-A2 -0.0080 0.99907 Table 2. Summary of HSD’s result Treatment Mean SD Summary (in letter or in dot form) A1 2.572 0.2546959   A2 1.676 0.3041874   A3 1.668 0.3562583

MATLAB: An Introduction with Applications
6th Edition
ISBN:9781119256830
Author:Amos Gilat
Publisher:Amos Gilat
Chapter1: Starting With Matlab
Section: Chapter Questions
Problem 1P
icon
Related questions
Question

CHICKEN FEED ADDITIVE STUDY
Instruction: For all test of hypotheses, write Ho and Ha in words, specify test 
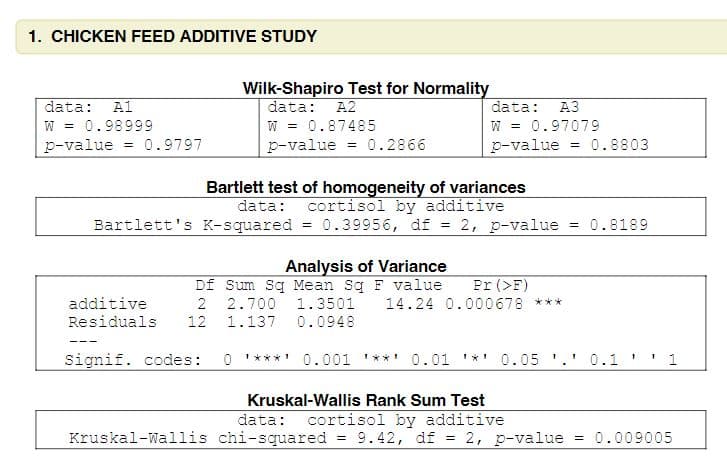
procedure, show computed test statistic with df (if applicable), p-value, decision and conclusion.A study was conducted to determine the effect of different types of feed additives(A1, A2, A3) in the cortisol level (ng/ml) among chickens. Fifteen chickens were randomly assigned to the three feed additives. The cortisol level (ng/ml) of the chickens was then measured after four weeks.
The data can be found in the worksheet “cortisol_level” of excel file 
“exer3_data.xlsx”. R outputs can be found in the file “exer3_outputs.pdf”

4. Suppose they conducted another set of experiment with increased sample size and saw that the three feed additives have different mean cortisol level. Table below showed summary of Tukey’s HSD. Summarize the result of Tukey’s HSD in Table 2 and provide synthesis. 
Table 1. Matrix of HSD’s test result for the experiment

Treatments Mean difference p-value
A2-A1 -0.8960 0.00154
A3-A1 -0.9040 0.00129
A3-A2 -0.0080 0.99907

Table 2. Summary of HSD’s result

Treatment Mean SD Summary (in letter or in dot form)
A1 2.572 0.2546959  
A2 1.676 0.3041874  
A3 1.668 0.3562583  

Synthesis:

____________________________

1. CHICKEN FEED ADDITIVE STUDY
data: Al
W = 0.98999
p-value
Wilk-Shapiro Test for Normality
data: A2
W = 0.87485
p-value = 0.2866
data: A3
W = 0.97079
p-value
0.9797
0.8803
%3!
Bartlett test of homogeneity of variances
cortisol by additive
data:
Bartlett's K-squared = 0.39956, df = 2, p-value
0.8189
Analysis of Variance
Df Sum Sq Mean Sq F value
Pr(>F)
14.24 0.000678 ***
additive
2.700 1.3501
Residuals
1.137 0.0948
---
Signif. codes:
O * ***' 0.001 '**' 0.01 '*' 0.05 '.' 0.1 '
Kruskal-Wallis Rank Sum Test
cortisol by additive
9.42, df = 2, p-value
data:
Kruskal-Wallis chi-squared
= 0.009005
A22
Transcribed Image Text:1. CHICKEN FEED ADDITIVE STUDY data: Al W = 0.98999 p-value Wilk-Shapiro Test for Normality data: A2 W = 0.87485 p-value = 0.2866 data: A3 W = 0.97079 p-value 0.9797 0.8803 %3! Bartlett test of homogeneity of variances cortisol by additive data: Bartlett's K-squared = 0.39956, df = 2, p-value 0.8189 Analysis of Variance Df Sum Sq Mean Sq F value Pr(>F) 14.24 0.000678 *** additive 2.700 1.3501 Residuals 1.137 0.0948 --- Signif. codes: O * ***' 0.001 '**' 0.01 '*' 0.05 '.' 0.1 ' Kruskal-Wallis Rank Sum Test cortisol by additive 9.42, df = 2, p-value data: Kruskal-Wallis chi-squared = 0.009005 A22
Expert Solution
steps

Step by step

Solved in 2 steps

Blurred answer
Recommended textbooks for you
MATLAB: An Introduction with Applications
Statistics
ISBN:
9781119256830
Author:
Amos Gilat
Publisher:
John Wiley & Sons Inc
Probability and Statistics for Engineering and th…
Statistics
ISBN:
9781305251809
Author:
Jay L. Devore
Publisher:
Cengage Learning
Statistics for The Behavioral Sciences (MindTap C…
Statistics
ISBN:
9781305504912
Author:
Frederick J Gravetter, Larry B. Wallnau
Publisher:
Cengage Learning
Elementary Statistics: Picturing the World (7th E…
Statistics
ISBN:
9780134683416
Author:
Ron Larson, Betsy Farber
Publisher:
PEARSON
The Basic Practice of Statistics
Statistics
ISBN:
9781319042578
Author:
David S. Moore, William I. Notz, Michael A. Fligner
Publisher:
W. H. Freeman
Introduction to the Practice of Statistics
Statistics
ISBN:
9781319013387
Author:
David S. Moore, George P. McCabe, Bruce A. Craig
Publisher:
W. H. Freeman