Costs and benefits of major U.S. federal regulations, 2003–2013 (average values from ranges of estimates, in billions of dollars) Agency Benefits Costs Benefits minus costs Benefit : Cost ratio Department of Energy 15.6 5.9 9.7 2.6 Department of Health and Human Services 32.4 4.6 Department of Transportation 25.4 11.6 Environmental Protection Agency (EPA) 507.2 42.2 Other departments 25.1 8.1 Total (billions of dollars) 605.7 72.4

Microeconomics A Contemporary Intro
10th Edition
ISBN:9781285635101
Author:MCEACHERN
Publisher:MCEACHERN
Chapter14: Transaction Costs, Imperfect Information, And Behavioral Economics
Section: Chapter Questions
Problem 4QFR
icon
Related questions
Question

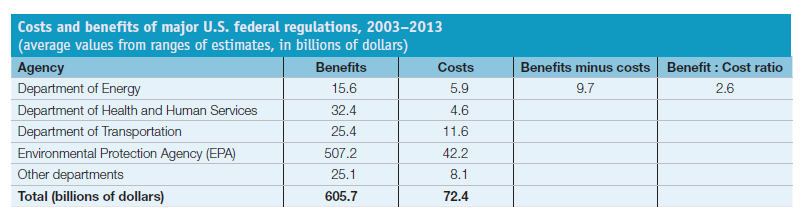
Critics of command-and-control policy often argue that regulations
are costly to business and industry, yet cost-benefit
analyses (p. 94) repeatedly show that regulations bring citizens
more benefits than costs, overall. Each year the U.S. Office
of Management and Budget assesses costs and benefits of
major federal regulations of administrative agencies. Results
from the most recent report, covering the decade from 2003
to 2013, are presented in the table (shown are averages from
ranges of estimates). Subtract costs from benefits, and enter
these values for each agency in the third column. Divide benefits
by costs, and enter these values in the fourth column.

For how many of the agencies shown do regulations exert
more costs than benefits? For how many do regulations
provide more benefits than costs?

Costs and benefits of major U.S. federal regulations, 2003–2013
(average values from ranges of estimates, in billions of dollars)
Agency
Benefits
Costs
Benefits minus costs
Benefit : Cost ratio
Department of Energy
15.6
5.9
9.7
2.6
Department of Health and Human Services
32.4
4.6
Department of Transportation
25.4
11.6
Environmental Protection Agency (EPA)
507.2
42.2
Other departments
25.1
8.1
Total (billions of dollars)
605.7
72.4
Transcribed Image Text:Costs and benefits of major U.S. federal regulations, 2003–2013 (average values from ranges of estimates, in billions of dollars) Agency Benefits Costs Benefits minus costs Benefit : Cost ratio Department of Energy 15.6 5.9 9.7 2.6 Department of Health and Human Services 32.4 4.6 Department of Transportation 25.4 11.6 Environmental Protection Agency (EPA) 507.2 42.2 Other departments 25.1 8.1 Total (billions of dollars) 605.7 72.4
Expert Solution
trending now

Trending now

This is a popular solution!

steps

Step by step

Solved in 2 steps

Blurred answer
Knowledge Booster
Vertical Restraints
Learn more about
Need a deep-dive on the concept behind this application? Look no further. Learn more about this topic, economics and related others by exploring similar questions and additional content below.
Similar questions
  • SEE MORE QUESTIONS
Recommended textbooks for you
Microeconomics A Contemporary Intro
Economics
ISBN:
9781285635101
Author:
MCEACHERN
Publisher:
Cengage
Managerial Economics: A Problem Solving Approach
Economics
ISBN:
9781337106665
Author:
Luke M. Froeb, Brian T. McCann, Michael R. Ward, Mike Shor
Publisher:
Cengage Learning