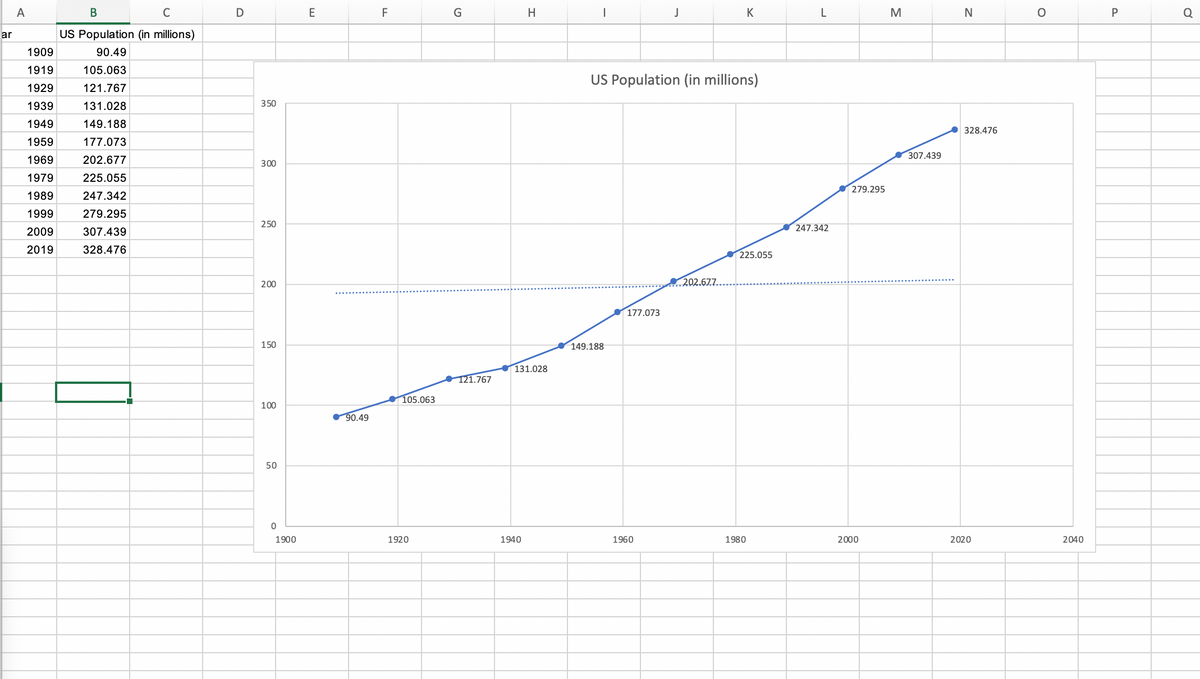
create a model using the first and third point in the data set to get the P for Population in millions. create a model for 3rd and 10th point of the data further below. I need to get the slope, etc. I don't understand the steps for modeling on a subset of the data. M is the slope, etc. Population = mx + b Year Population in millions 1909 90.49 1919 105.063 1929 121.767 this is a subset of the scatter plot for: Year US Population (in millions) 1909 90.49 1919 105.063 1929 121.767 1939 131.028 1949 149.188 1959 177.073 1969 202.677 1979 225.055 1989 247.342 1999 279.295 2009 307.439 2019 328.476


Correlation
Correlation defines a relationship between two independent variables. It tells the degree to which variables move in relation to each other. When two sets of data are related to each other, there is a correlation between them.
Linear Correlation
A correlation is used to determine the relationships between numerical and categorical variables. In other words, it is an indicator of how things are connected to one another. The correlation analysis is the study of how variables are related.
Regression Analysis
Regression analysis is a statistical method in which it estimates the relationship between a dependent variable and one or more independent variable. In simple terms dependent variable is called as outcome variable and independent variable is called as predictors. Regression analysis is one of the methods to find the trends in data. The independent variable used in Regression analysis is named Predictor variable. It offers data of an associated dependent variable regarding a particular outcome.
create a model using the first and third point in the data set to get the P for Population in millions.
create a model for 3rd and 10th point of the data further below.
I need to get the slope, etc. I don't understand the steps for modeling on a subset of the data.
M is the slope, etc.
Population = mx + b
Year Population in millions
| 1909 | 90.49 |
| 1919 | 105.063 |
| 1929 | 121.767 |
this is a subset of the
| Year | US Population (in millions) |
| 1909 | 90.49 |
| 1919 | 105.063 |
| 1929 | 121.767 |
| 1939 | 131.028 |
| 1949 | 149.188 |
| 1959 | 177.073 |
| 1969 | 202.677 |
| 1979 | 225.055 |
| 1989 | 247.342 |
| 1999 | 279.295 |
| 2009 | 307.439 |
| 2019 | 328.476 |


Trending now
This is a popular solution!

Step by step
Solved in 4 steps with 4 images


