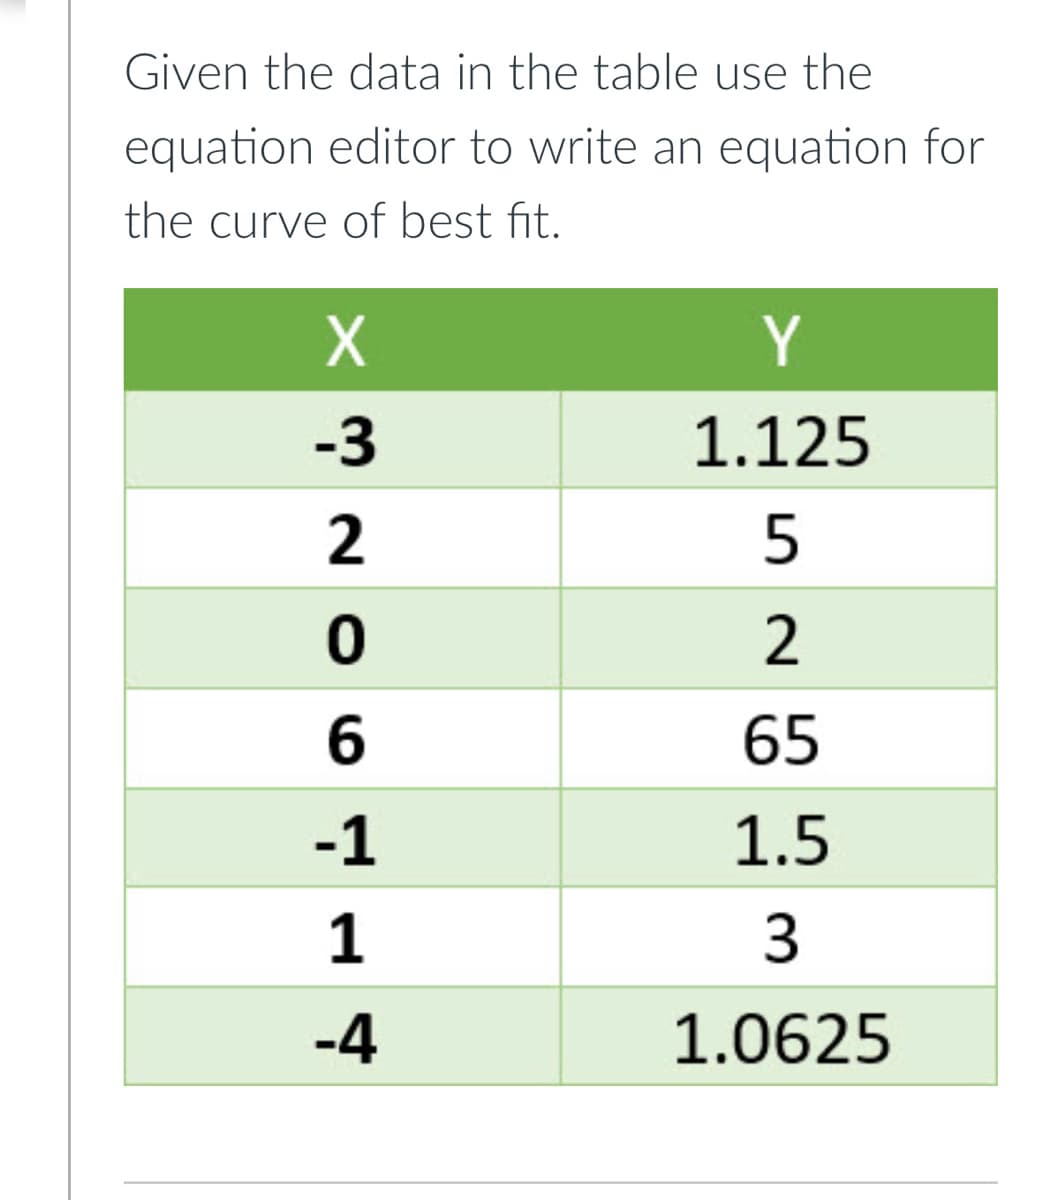
Given the data in the table use the equation editor to write an equation for the curve of best fit. Y -3 1.125 5 2 6. 65 -1 1.5 1 3 -4 1.0625


Q: For the data given below, answer parts (a) through (f). - 4 - 2 4 y - 4 - 1 1 4. ...... (b) Find the…
A: from given table
Q: least squar the slope rcept data: X 2 7 9 1 5 13 21 23 14 15
A: As per given by the question, There are given that the value of x and y. Now, Calculate the least…
Q: B D Consumer Goods Capital Goods
A:
Q: B D Consumer Goods Capital Goods
A:
Q: The following was a possible model for the data using the 1939 population value. The slope…
A: Consider the given information.
Q: tudent/dashboard/home Mrs. Kelly measures the length of the wings of some butterflies to the nearest…
A:
Q: a. Plot a scatter diagram. b. If 60 is the minimum passing grade, below which placement test score…
A: Regression: Regression analysis is used measure the association between two are more variables where…
Q: Find the range and interquartile range of the data represented by the box-and-whisker plot. The…
A:
Q: This study aims to find the correlation between the number of weeks of gestation and the weight of…
A: Correlation is a statistical technique used for analyzing the behavior of two or more variates. Its…
Q: pediatrician wants to determine the relation that may exist between a child's height and head…
A: Step-by-step procedure to find the regression line using Excel: In Excel sheet, enter x and y in…
Q: 3) Assume that you are facing the following set of data. What specification would you use to…
A: Regression analysis, allows you you to infer that there is a relationship between two or more…
Q: The trend and shape of this scatterplot displaying the ages of husbands and wives is: O a. Negative…
A: Given the scatter plot of Husbands and Wives. We need to answer, the trend and shape of this…
Q: Plot the points listed in the table below (label the scale and axes). y -2 -3 -1 -1 1 1 2
A:
Q: To determine how women's heights influence her pulse rate. A random sample of 40 women is obtained,…
A: Note: " Since you have posted many sub-parts. we will solve the first three sub-parts for you. To…
Q: eason. Using the data given, answer the questions below: Team ERA Wins Chicago White Sox 4.4…
A: The independent variable is XX, and the dependent variable is YY. In order to compute the regression…
Q: You have to study the relationship between the monthly e-commerce sales and the online advertising…
A: Since you have posted multiple questions, we will solve the first question for you. To get the…
Q: n: Read the problem at the center circle and answer the question found on each petal of the e flower…
A: Use equation of line
Q: The table below shows the expected years remainıng in a person's life given a person's curent age.…
A: "Since you have posted a question with multiple subparts, we will solve first 3 sub-parts for you.…
Q: (a) Write an approximate equation of the line of best fit for the data. It doesn't have to be the…
A: The scatter plot shows the time spent watching TV, 'x' doing homework, 'y' by each of the 24…
Q: (a) Write an approximate equation of the line of best fit for the data. It doesn't have to be the…
A: A scatter plot is given, to find out the approximate line of regression and to predict the score…
Q: Given the data in the table find the equation for the curve of best fit. Use the equation editor to…
A:
Q: Select your answer- b. What does the scatter diagram developed in part (a) indicate about the…
A: Since you have posted a question with multiple subparts, we will solve first three subparts for you.…
Q: Find the equation of the curve that joins the following points. Hint: Use common differences. (a)…
A: As per company guidelines we are allowed to solve one question at a time so i am solving first one…
Q: The data points on the scatter plot below show the amount of time spent watching television and the…
A: The line of best fit is an approximate line for all the different datapoints in a plot. The idea is…
Q: Using the quadratic curve of best fit, which equation most closely represents the set of data? {…
A: To find the right quadratic equation that represents the given data
Q: 4: The number of trademark applications for items with a stars-and-stripes motif is given in the…
A: To Find: a) The equation for a model for these data. b) Give the vertex of the model and what does…
Q: Student Class Grade Solve the following problems using the scatter plot. Refer to previous slides if…
A: Solution : Given : Scatter plot of Students Absence vs Grades From given scatter plot, data in…
Q: For the data given below, answer parts (a) through (f). -2 - 1 y 4 3 ..... (a) Draw a scatter plot.…
A: NOTE - As per our guidelines we have to answer only first three sub parts if multiple sub parts are…
Q: Use the information for questions 4-5. EDUCATION The table gives the number of hours spent studying…
A: The independent variable is Study Hours. The dependent variable is Grade. The given data represents…
Q: A scatter-plot was made to show the value of certain cars based on the age of the car in years. The…
A:
Q: A scatter plot was made to show the value of certain cars based on the age of the car in years. The…
A:
Q: The data points on the scatter plot below show the number of hours worked and the amount of money…
A: BEST FIT LINE SHOULD BE LINE SUCH THAT ALL POINTS ARE VERY NEAR TO LINE. You may choose the point by…
Q: -3 |-2 |-1 1 3 2. Suppose you're given the following data set: y 0 78 -3 3 -8 -7 i] Sketch a…
A: (i) scatter plot of data
Q: Input 'X' Family Median Percentiles OutPut 'Y' Percent Of Children Attending College 100 94 1…
A: The given data is: From the given data, the points on the graph represented by the linear equation…
Q: t measure of central tendency
A: Slipping on banana getting surface is smooth. Mean: Mean is the most useful measure of central…
Q: Use graphing paper to plot the following points then connect the points as coordinates. A. a.…
A: Solution a: Given points are x y 4.5 3.0 10 5 5 9 4.5 10 Graph that connect the points…
Q: Q5) Fit a straight line to the data given below. Also estimate the value of y at x=2.5. Ans. y=4.045
A:
Q: A regression analysis was performed to determine if there is a relationship between hours of TV…
A: From the given information, The regression equation is y=-0.985x+31.518. Here, x represents the…
Q: A pet store surveys 20 people who enter the store to ask how many pets each shopper has. The results…
A: Histogram is a graphical representation of continuous frequency data.According to the provided…
Q: where bcan be positive or negative. 3,78 2.75 2.01 0.100 0.200 0.300 You wish to determine the value…
A: The function is in the form of y=aebx .................................... (1) The given table is,…
Q: The velocity of an object is shown in the graph below 7+ 6- 5- 2 1 1 2 3 4 5 4) 3. Velocity (m/s)
A: We are given the velocity profile. Now, we need to find the distance by the given integral. Note…
Q: a) Make a scatter plot of the data in the table below. -2 - 1 3 4. 32 6. 2 - 6 - 20 b) Does it…
A:
Q: Using the curve, which letter represents inefficiency?
A: From the given figure it is clearly observed that, The points B,C and D are efficient output…
Q: Which statement does not describe the dot plot? Math Test Score XXX> XXXX 123 4 5 6 7 Score 9 10 O…
A: Range: Range is the difference between highest and lowest value In our data Highest value=10…
Q: The diagram below shows a box-and-whisker plot of a set of data. The interquartile range of the data…
A: The interquartile range is the difference between upper quartile and lower quartile. Interquartile…
Q: Plot and interpret the following data on a graphing paper. Determine what equation is to be used…
A: To plot and interpret the following data.
Q: Use the regression capabilities of a graphing calculator to find the equation for the line of best…
A: Use Ti calculator to find the equation for the line of best fit as follows: Select STAT > Edit…
Q: The correlation coefficient is a measure of: a. Slope b. The strength of a cause and effect…
A: Given: Correlation: It measures the strengths of the relation between the variables. And the…
Q: Soil Mixture Ratio y 6 2 4 6 8 Amount of Topsoil (cubic yards) Amount of Compost (cubic yards) 4.
A: In this question, we need to find the equation of line from the graph.


Trending now
This is a popular solution!

Step by step
Solved in 2 steps with 3 images

- What is the mean of the curve in Figure (a)?What is the mean of the curve in Figure (b)?Fit the best fitting line to the following data: Question to answer: A. Best fitting straight line? Kindly answer it fast. Thank youWhat is a name for the curve that has the mean, median and mode at the center? Mesokurtic Platykurtic Gaussian
- Which table correctly expresses the joint and marginal relative frequencies?The normal daily temperature for Honolulu, Hawaii are given by the following table. Find the equation that will model this data.List three variables, and how they are measured, for which you would use the mode as the most appropriate measure of central tendency.
- How does the speed of a runner vary over the course of a marathon (adistance of 42.195 km)? Consider determining both the time to run thefirst 5 km and the time to run between the 35-km and 40-km points, andthen subtracting the former time from the latter time. A positive value ofthis difference corresponds to a runner slowing down toward the end ofthe race. The accompanying histogram is based on times of runners who participated in several different Japanese marathons ("Factors AffectingRunners' Marathon Performance," Chance, Fall, 1993: 24-30).What are some interesting features of this histogram? What is a typicaldifference value? Roughly what proportion of the runners ran the latedistance more quickly than the early distance?Complete the table and solve the coefficient of correlation. with solution amd explanation please.Portray the following hypothetical data on a two-variable diagram Measure the slope of the resulting line, and explain what this number means
