CUiveit the average temperatures for each collected data point in the Experimental section from °C to K. Using a spreadsheet program, plot the average cell potentials E (y- axis) vs T (x-axis). The plot should be approximately linear. Add a trendline to find the best linear fit and enter the y- intercept and slope (b and m from the linear equation) for the trendline below.
CUiveit the average temperatures for each collected data point in the Experimental section from °C to K. Using a spreadsheet program, plot the average cell potentials E (y- axis) vs T (x-axis). The plot should be approximately linear. Add a trendline to find the best linear fit and enter the y- intercept and slope (b and m from the linear equation) for the trendline below.

Big Ideas Math A Bridge To Success Algebra 1: Student Edition 2015
1st Edition
ISBN:9781680331141
Author:HOUGHTON MIFFLIN HARCOURT
Publisher:HOUGHTON MIFFLIN HARCOURT
Chapter11: Data Analysis And Displays
Section11.3: Shapes Of Distributions
Problem 20E

Related questions
Question
Using my data in the image, please help find the Y-int following the directions in the image i attached :) thank you
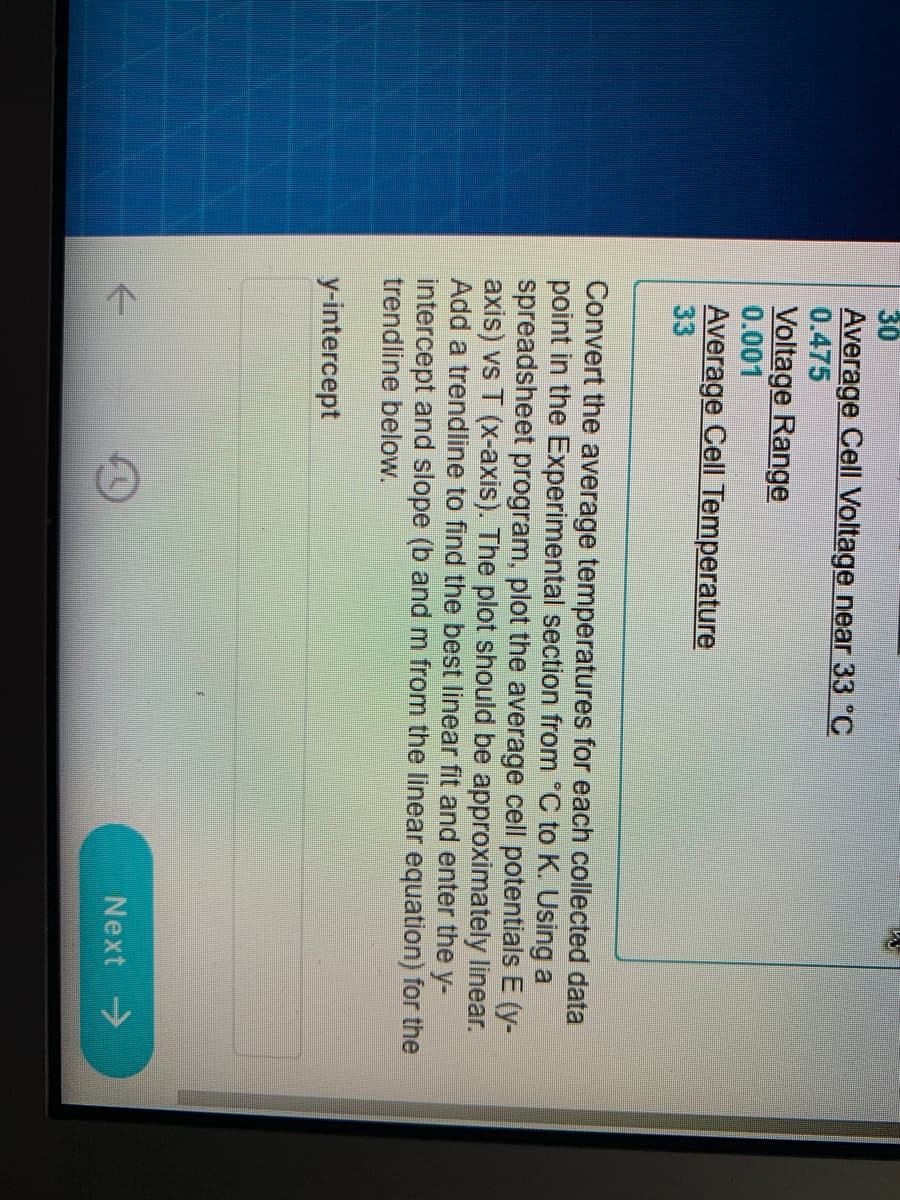
Transcribed Image Text:30
Average Cell Voltage near 33 °C
0.475
Voltage Range
0.001
Average Cell Temperature
33
Convert the average temperatures for each collected data
point in the Experimental section from "C to K. Using a
spreadsheet program, plot the average cell potentials E (y-
axis) vs T (x-axis). The plot should be approximately linear.
Add a trendline to find the best linear fit and enter the y-
intercept and slope (b and m from the linear equation) for the
trendline below.
y-intercept
Next ->
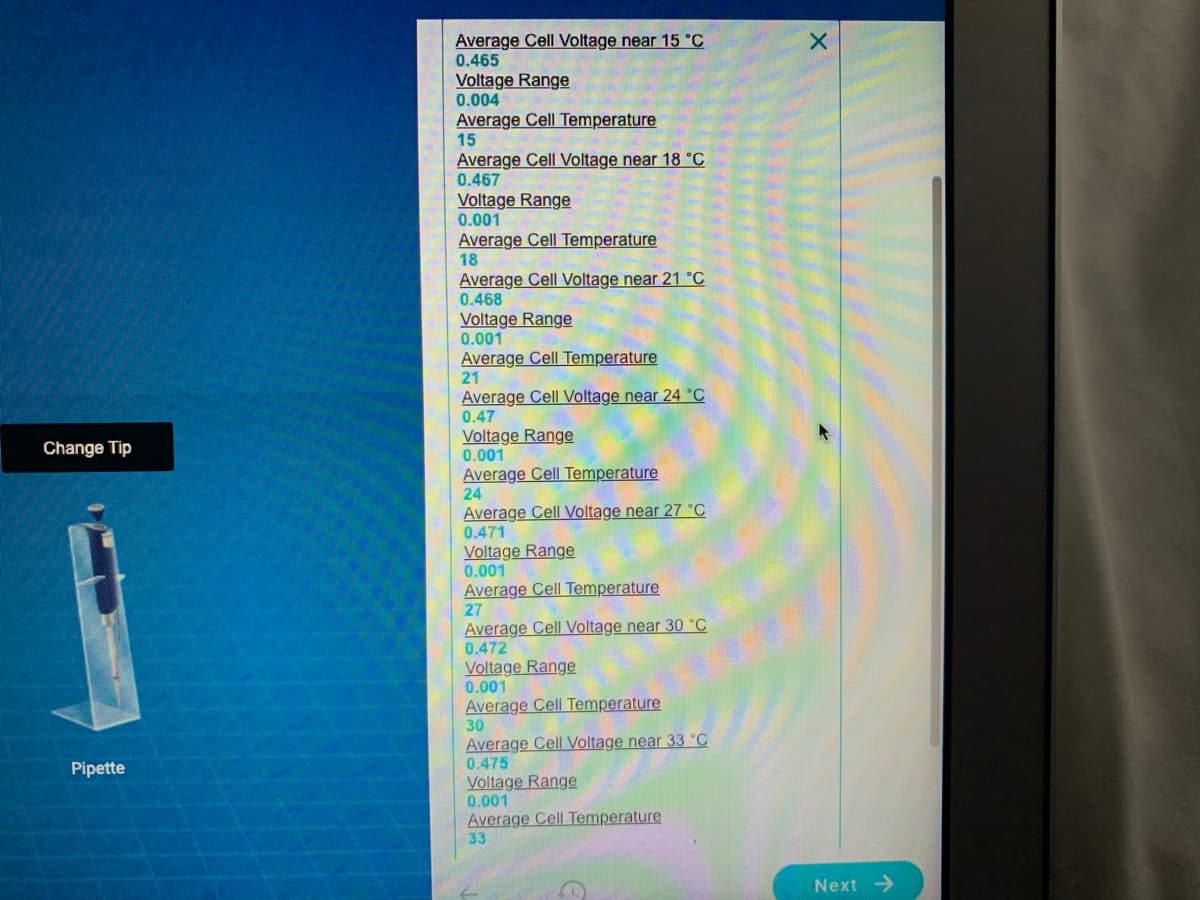
Transcribed Image Text:Average Cell Voltage near 15 °C
0.465
Voltage Range
0.004
Average Cell Temperature
15
Average Cell Voltage near 18 °C
0.467
Voltage Range
0.001
Average Cell Temperature
18
Average Cell Voltage near 21 °C
0.468
Voltage Range
0.001
Average Cell Temperature
21
Average Cell Voltage near 24 °C
0.47
Voltage Range
0.001
Average Cell Temperature
Change Tip
24
Average Cell Voltage near 27 °C
0.471
Voltage Range
0.001
Average Cell Temperature
27
Average Cell Voltage near 30 °C
0.472
Voltage Range
0.001
Average Cell Temperature
30
Average Cell Voltage near 33 "C
0.475
Pipette
Voltage Range
0.001
Average Cell Temperature
33
Next >
Expert Solution
This question has been solved!
Explore an expertly crafted, step-by-step solution for a thorough understanding of key concepts.

This is a popular solution!

Trending now
This is a popular solution!

Step by step
Solved in 2 steps with 4 images

Knowledge Booster


Learn more about
Need a deep-dive on the concept behind this application? Look no further. Learn more about this topic, calculus and related others by exploring similar questions and additional content below.Recommended textbooks for you
Big Ideas Math A Bridge To Success Algebra 1: Stu…
Algebra
ISBN:
9781680331141
Author:
HOUGHTON MIFFLIN HARCOURT
Publisher:
Houghton Mifflin Harcourt

Linear Algebra: A Modern Introduction
Algebra
ISBN:
9781285463247
Author:
David Poole
Publisher:
Cengage Learning
Big Ideas Math A Bridge To Success Algebra 1: Stu…
Algebra
ISBN:
9781680331141
Author:
HOUGHTON MIFFLIN HARCOURT
Publisher:
Houghton Mifflin Harcourt
Linear Algebra: A Modern Introduction
Algebra
ISBN:
9781285463247
Author:
David Poole
Publisher:
Cengage Learning