culate Select RatioS - Excel FILE PAGE LAYOUT Sign In HOME INSERT FORMULAS DATA REVIEW VIEW Calibri -11 A A % Alignment Number Conditional Format as Cell Formatting Table Styles Paste BIU A Cells Editing Clipboard a Font Styles D23 fe A D E 20 Income Statement $ 3,031,000 21 Net Sales (all on account) 22 Cost of Goods Sold 23 Gross Profit 24 Operating Expenses 25 Income from Operations 26 Interest Expense 27 Income before Income Tax Expense 28 Income Tax Expense 29 Net Income 1,949,000 1,082,000 891,400 190,600 14,500 176,100 47,000 129,100 $ 30 31 Required: 32 Compute the following liquidity ratios for Year 3. Round to the 33 required number of decimal places USING THE EXCEL. 34 ROUND FUNCTION (fx). 35 Current ratio (rounded to one decimal place) 36 Receivables turnover (rounded to two decimal places) 37 Days to collect (rounded to the nearest whole day) 38 Inventory turnover (rounded to two decimal places) 39 Days to sell (rounded to the nearest whole day) to 1 |times ]days times days 40 41 Compute the following Solvency Ratios for Year 3. Again, USE 42 THE EXCEL ROUND FUNCTION (fx). 43 Debt to assets (rounded to two decimal places) 44 Times interest earned (rounded to one decimal place) to 1 times 45 46 Compute the following Profitability Ratios for Year 3. Again, USE 47 THE EXCEL ROUND FUNCTION (fx). Net profit margin (rounded to one decimal place) 49 Gross profit percentage (rounded to one decimal place) percent percent 48 50 51 Sheet1
culate Select RatioS - Excel FILE PAGE LAYOUT Sign In HOME INSERT FORMULAS DATA REVIEW VIEW Calibri -11 A A % Alignment Number Conditional Format as Cell Formatting Table Styles Paste BIU A Cells Editing Clipboard a Font Styles D23 fe A D E 20 Income Statement $ 3,031,000 21 Net Sales (all on account) 22 Cost of Goods Sold 23 Gross Profit 24 Operating Expenses 25 Income from Operations 26 Interest Expense 27 Income before Income Tax Expense 28 Income Tax Expense 29 Net Income 1,949,000 1,082,000 891,400 190,600 14,500 176,100 47,000 129,100 $ 30 31 Required: 32 Compute the following liquidity ratios for Year 3. Round to the 33 required number of decimal places USING THE EXCEL. 34 ROUND FUNCTION (fx). 35 Current ratio (rounded to one decimal place) 36 Receivables turnover (rounded to two decimal places) 37 Days to collect (rounded to the nearest whole day) 38 Inventory turnover (rounded to two decimal places) 39 Days to sell (rounded to the nearest whole day) to 1 |times ]days times days 40 41 Compute the following Solvency Ratios for Year 3. Again, USE 42 THE EXCEL ROUND FUNCTION (fx). 43 Debt to assets (rounded to two decimal places) 44 Times interest earned (rounded to one decimal place) to 1 times 45 46 Compute the following Profitability Ratios for Year 3. Again, USE 47 THE EXCEL ROUND FUNCTION (fx). Net profit margin (rounded to one decimal place) 49 Gross profit percentage (rounded to one decimal place) percent percent 48 50 51 Sheet1

Intermediate Accounting: Reporting And Analysis
3rd Edition
ISBN:9781337788281
Author:James M. Wahlen, Jefferson P. Jones, Donald Pagach
Publisher:James M. Wahlen, Jefferson P. Jones, Donald Pagach
Chapter4: The Balance Sheet And The Statement Of Shareholders' Equity
Section: Chapter Questions
Problem 16P: Ratios Analyses: McCormick Refer to the information for McCormick above. Additional information for...

Related questions
Question
Transcribed Image Text:Calculate Select Ratios - Excel
?
FILE
HOME
INSERT
PAGE LAYOUT
FORMULAS
DATA
REVIEW
VIEW
Sign In
Calibri
11
A A
%
в I U
Alignment Number
Conditional Format as
Cell
Editing
Paste
Cells
Formatting Table Styles
Clipboard a
Font
Styles
D23
fe
A
B
D
E
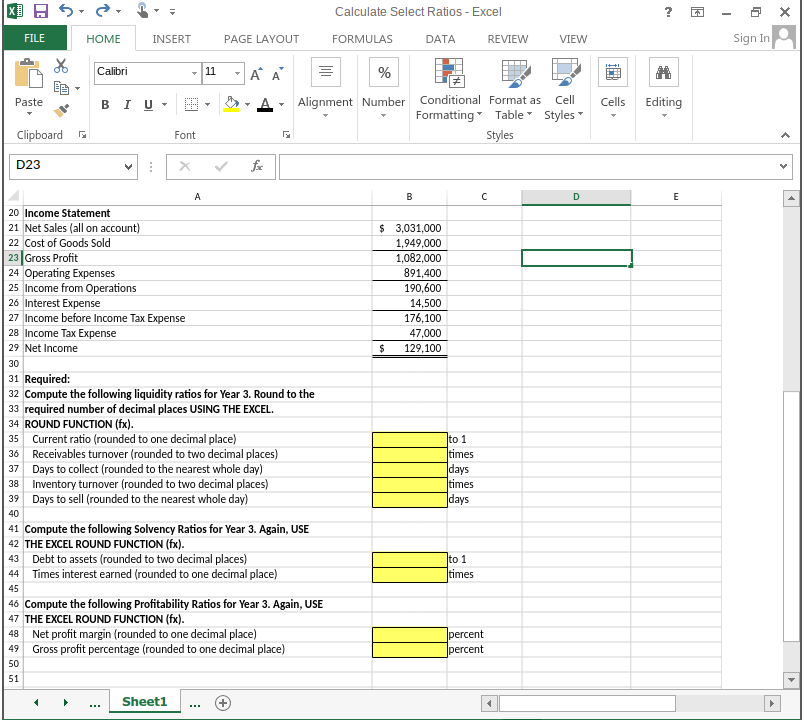
20 Income Statement
21 Net Sales (all on account)
22 Cost of Goods Sold
23 Gross Profit
24 Operating Expenses
25 Income from Operations
26 Interest Expense
27 Income before Income Tax Expense
$ 3,031,000
1,949,000
1,082,000
891,400
190,600
14,500
176,100
28 Income Tax Expense
29 Net Income
47,000
$
129,100
30
31 Required:
32 Compute the following liquidity ratios for Year 3. Round to the
33 required number of decimal places USING THE EXCEL.
34 ROUND FUNCTION (fx).
35 Current ratio (rounded to one decimal place)
36 Receivables turnover (rounded to two decimal places)
37 Days to collect (rounded to the nearest whole day)
38 Inventory turnover (rounded to two decimal places)
39 Days to sell (rounded to the nearest whole day)
to 1
times
days
times
days
40
41 Compute the following Solvency Ratios for Year 3. Again, USE
42 THE EXCEL ROUND FUNCTION (fx).
43 Debt to assets (rounded to two decimal places)
44 Times interest earned (rounded to one decimal place)
to 1
times
45
46 Compute the following Profitability Ratios for Year 3. Again, USE
47 THE EXCEL ROUND FUNCTION (fx).
48 Net profit margin (rounded to one decimal place)
Gross profit percentage (rounded to one decimal place)
percent
percent
49
50
51
Sheet1
....
Transcribed Image Text:Calculate Select Ratios - Excel
Sign In
FILE
HOME
INSERT
PAGE LAYOUT
FORMULAS
DATA
REVIEW
VIEW
Calibri
A A
11
%
BI U
Alignment Number Conditional Format as Cll
Formatting Table Styles
Paste
Cells
Editing
Clipboard
Font
Styles
D23
fe
A
B
D
E
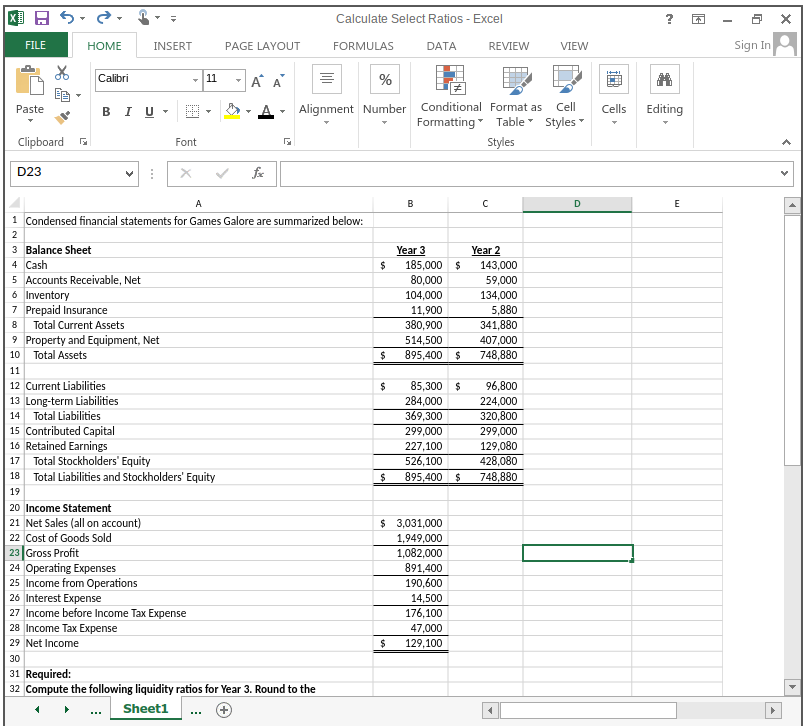
1 Condensed financial statements for Games Galore are summarized below:
3 Balance Sheet
4 Cash
5 Accounts Receivable, Net
6 Inventory
7 Prepaid Insurance
Year 2
Year 3
185,000 $
80,000
143,000
59,000
104,000
134,000
5,880
341,880
11,900
8
Total Current Assets
380,900
9 Property and Equipment, Net
10 Total Assets
514,500
407,000
895,400 $
748,880
11
12 Current Liabilities
85,300 $
284,000
369,300
299,000
$
96,800
13 Long-term Liabilities
14 Total Liabilities
15 Contributed Capital
16 Retained Earnings
Total Stockholders' Equity
18 Total Liabilities and Stockholders' Equity
224,000
320,800
299,000
129,080
428,080
227,100
526,100
895,400 $
17
748,880
19
20 Income Statement
21 Net Sales (all on account)
$ 3,031,000
22 Cost of Goods Sold
1,949,000
23 Gross Profit
24 Operating Expenses
25 Income from Operations
26 Interest Expense
27 Income before Income Tax Expense
1,082,000
891,400
190,600
14,500
176,100
47,000
28 Income Tax Expense
29 Net Income
129,100
30
31 Required:
32 Compute the following liquidity ratios for Year 3. Round to the
Sheet1
...
>
Expert Solution
Step 1
Ratio is a tool which is used to measure or evaluate the profitability of a firm by establishing relation between different figures of financial statements.

Trending now
This is a popular solution!

Step by step
Solved in 2 steps with 2 images

Knowledge Booster


Learn more about
Need a deep-dive on the concept behind this application? Look no further. Learn more about this topic, finance and related others by exploring similar questions and additional content below.Recommended textbooks for you
Intermediate Accounting: Reporting And Analysis
Accounting
ISBN:
9781337788281
Author:
James M. Wahlen, Jefferson P. Jones, Donald Pagach
Publisher:
Cengage Learning

Cornerstones of Financial Accounting
Accounting
ISBN:
9781337690881
Author:
Jay Rich, Jeff Jones
Publisher:
Cengage Learning

Financial And Managerial Accounting
Accounting
ISBN:
9781337902663
Author:
WARREN, Carl S.
Publisher:
Cengage Learning,
Intermediate Accounting: Reporting And Analysis
Accounting
ISBN:
9781337788281
Author:
James M. Wahlen, Jefferson P. Jones, Donald Pagach
Publisher:
Cengage Learning
Cornerstones of Financial Accounting
Accounting
ISBN:
9781337690881
Author:
Jay Rich, Jeff Jones
Publisher:
Cengage Learning
Financial And Managerial Accounting
Accounting
ISBN:
9781337902663
Author:
WARREN, Carl S.
Publisher:
Cengage Learning,

Fundamentals of Financial Management (MindTap Cou…
Finance
ISBN:
9781337395250
Author:
Eugene F. Brigham, Joel F. Houston
Publisher:
Cengage Learning

Financial & Managerial Accounting
Accounting
ISBN:
9781285866307
Author:
Carl Warren, James M. Reeve, Jonathan Duchac
Publisher:
Cengage Learning

College Accounting, Chapters 1-27 (New in Account…
Accounting
ISBN:
9781305666160
Author:
James A. Heintz, Robert W. Parry
Publisher:
Cengage Learning