C6. The following cross-tabulation, based on GSS18SSDS-B data, examines the relationshin between age (the independent variable) and whether or not one feels discriminated against because of age. As with Exercise 2, we have recoded age into four categories: 18-29, 30-39, 40-49, and 50–59. Respondents of all other ages have been excluded from the analysis. a. What percentage of the sample did not feel they were subjected to age discrimination? b. How many people between the ages of 30 and 39 reported feeling discriminated against because of their age?
C6. The following cross-tabulation, based on GSS18SSDS-B data, examines the relationshin between age (the independent variable) and whether or not one feels discriminated against because of age. As with Exercise 2, we have recoded age into four categories: 18-29, 30-39, 40-49, and 50–59. Respondents of all other ages have been excluded from the analysis. a. What percentage of the sample did not feel they were subjected to age discrimination? b. How many people between the ages of 30 and 39 reported feeling discriminated against because of their age?

Glencoe Algebra 1, Student Edition, 9780079039897, 0079039898, 2018
18th Edition
ISBN:9780079039897
Author:Carter
Publisher:Carter
Chapter4: Equations Of Linear Functions
Section: Chapter Questions
Problem 8SGR

Related questions
Question
Transcribed Image Text:between racê afnu
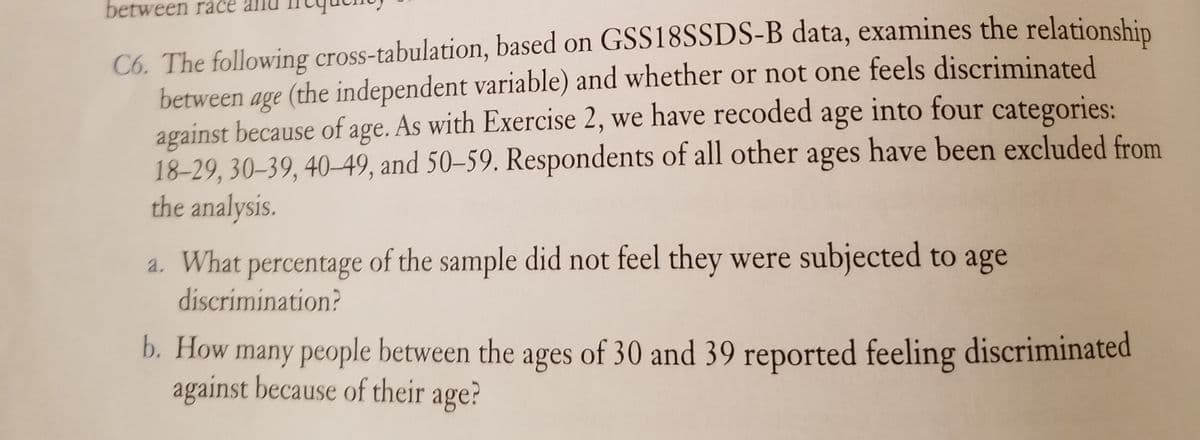
C6. The following cross-tabulation, based on GSS18SSDS-B data, examines the relationshin
between age (the independent variable) and whether or not one feels discriminated
against because of age. As with Exercise 2, we have recoded age into four categories:
18–29, 30–39, 40–49, and 50–59. Respondents of all other ages have been excluded from
the analysis.
a. What percentage of the sample did not feel they were subjected to age
discrimination?
b. How many people between the ages of 30 and 39 reported feeling discriminated
against because of their age?
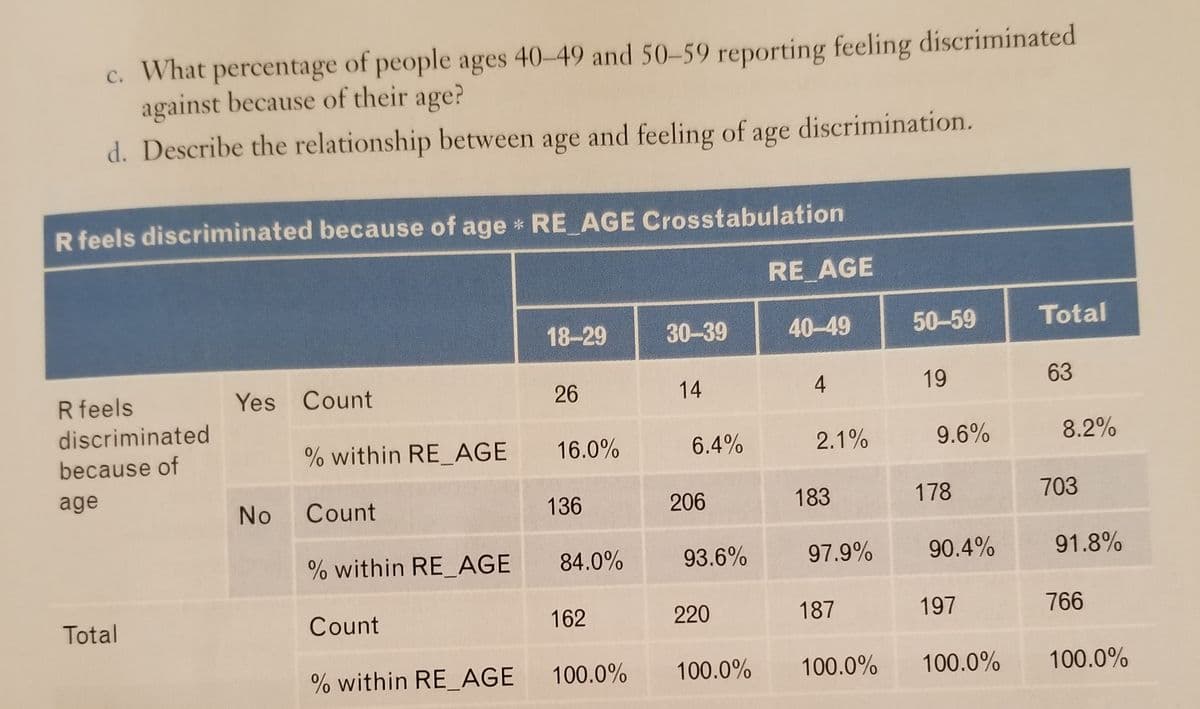
Transcribed Image Text:c. What percentage of people ages 40-49 and 50-59 reporting feeling discriminated
against because of their age?
d. Describe the relationship between age and feeling of age discrimination.
R feels discriminated because of age * RE AGE Crosstabulation
RE AGE
18-29
30-39
40-49
50-59
Total
R feels
Yes Count
26
14
4
19
63
discriminated
because of
% within RE_AGE 16.0%
6.4%
2.1%
9.6%
8.2%
age
No
Count
136
206
183
178
703
% within RE_AGE
84.0%
93.6%
97.9%
90.4%
91.8%
Total
Count
162
220
187
197
766
% within RE_AGE 100.0%
100.0%
100.0%
100.0%
100.0%
Expert Solution
This question has been solved!
Explore an expertly crafted, step-by-step solution for a thorough understanding of key concepts.

This is a popular solution!

Trending now
This is a popular solution!

Step by step
Solved in 2 steps

Recommended textbooks for you
Glencoe Algebra 1, Student Edition, 9780079039897…
Algebra
ISBN:
9780079039897
Author:
Carter
Publisher:
McGraw Hill
Glencoe Algebra 1, Student Edition, 9780079039897…
Algebra
ISBN:
9780079039897
Author:
Carter
Publisher:
McGraw Hill