(d) Calculate the sample correlation and the sample covariance by hand for the first 8 observations of the two variables you use in the scatterplot. Show all of your work. (You can use a calculator for the algebra, but
(d) Calculate the sample correlation and the sample covariance by hand for the first 8 observations of the two variables you use in the scatterplot. Show all of your work. (You can use a calculator for the algebra, but

Functions and Change: A Modeling Approach to College Algebra (MindTap Course List)
6th Edition
ISBN:9781337111348
Author:Bruce Crauder, Benny Evans, Alan Noell
Publisher:Bruce Crauder, Benny Evans, Alan Noell
Chapter3: Straight Lines And Linear Functions
Section3.3: Modeling Data With Linear Functions
Problem 23SBE

Related questions
Question
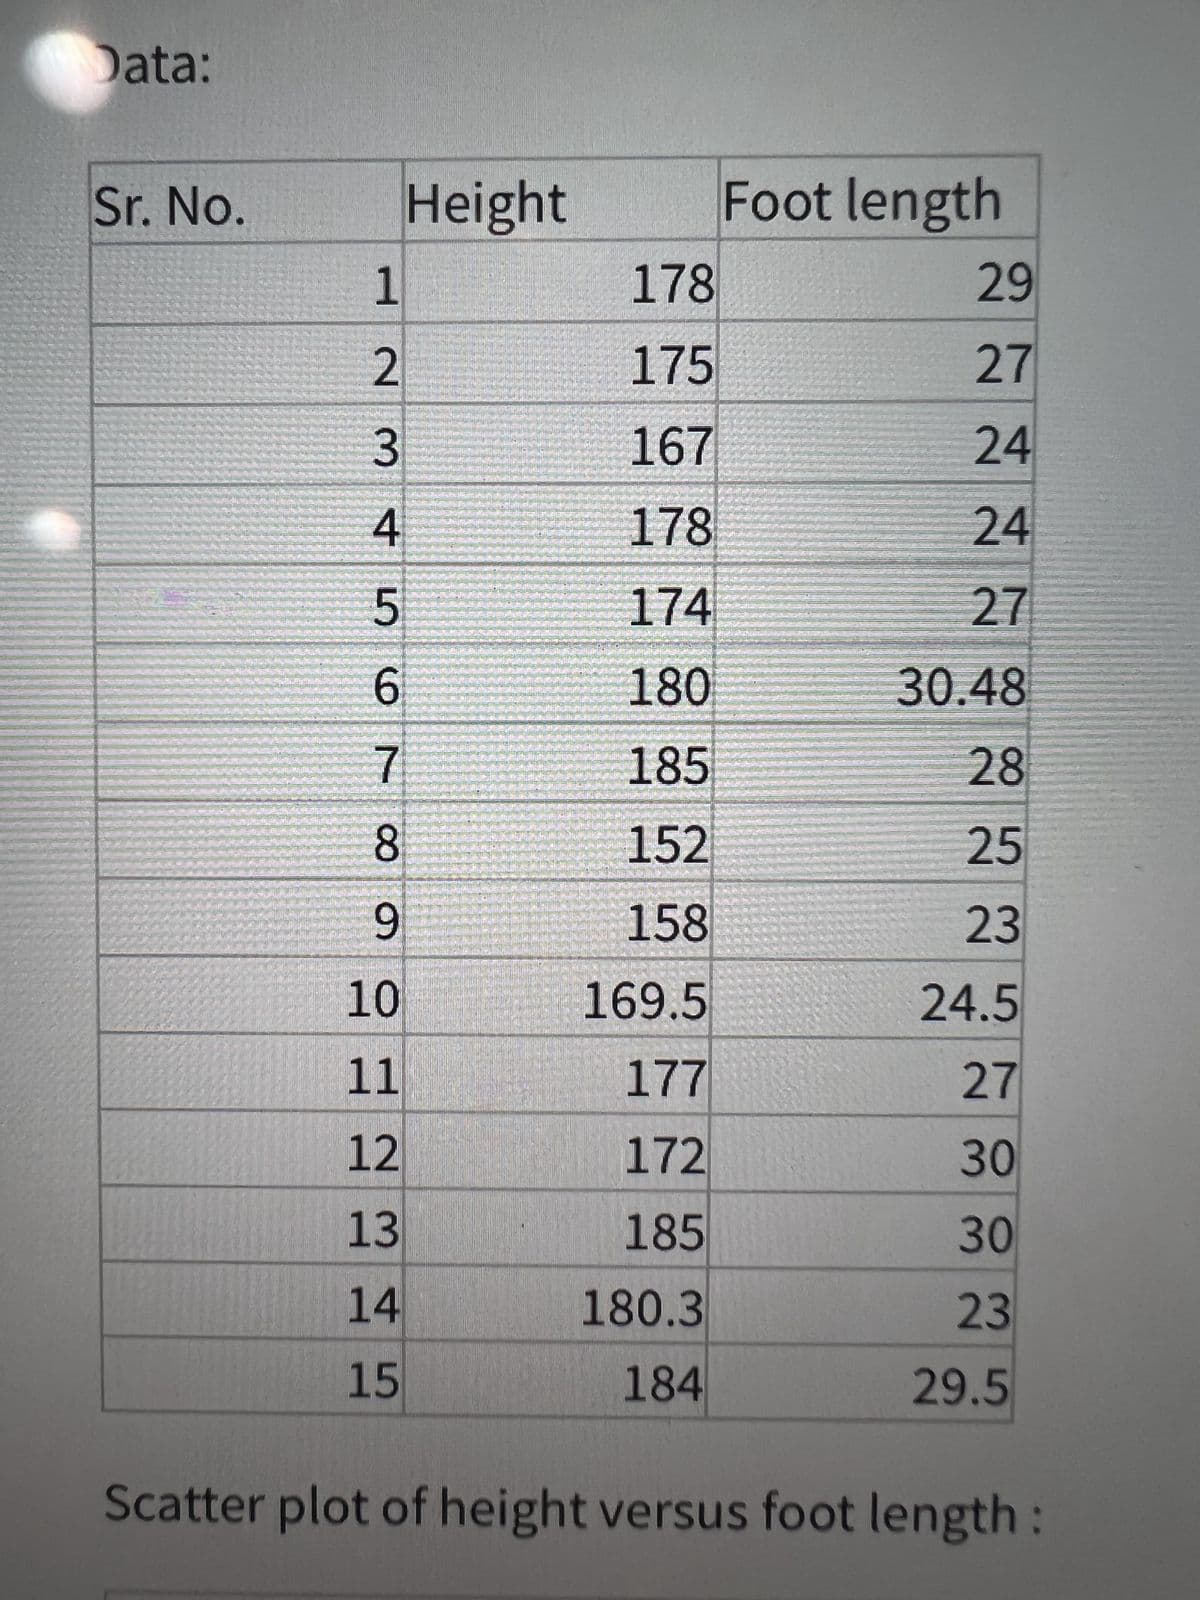
Transcribed Image Text:Data:
Sr. No.
1
2
Height
178
29
175
27
167
24
178
24
174
27
6
180
30.48
7
185
28
8
152
25
9
158
23
10
169.5
24.5
11
177
27
12
172
30
13
185
30
14
180.3
23
15
184
29.5
Scatter plot of height versus foot length:
345
Foot length
Transcribed Image Text:(d) Calculate the sample
correlation and the sample
covariance by hand for the first 8
observations of the two variables
you use in the scatterplot. Show
all of your work. (You can use a
calculator for the algebra, but
write out all of the equations.)
(e) Using a computer program,
calculate the regression line for
your scatterplot. Plot this line on
the scatterplot. (This is fairly
straightforward to do in excel,
and there are a number of
websites that will explain how to
do so.) You can also plot the line
on a hand-drawn scatterplot if
you prefer (though you will
probably need to use a computer
program to calculate the
equation).
(f) Briefly describe the
relationship between the two
variables. Reference the meaning
of the correlation, covariance,
scatterplot, and regression line.
Expert Solution
This question has been solved!
Explore an expertly crafted, step-by-step solution for a thorough understanding of key concepts.

This is a popular solution!

Trending now
This is a popular solution!

Step by step
Solved in 4 steps with 4 images

Recommended textbooks for you
Functions and Change: A Modeling Approach to Coll…
Algebra
ISBN:
9781337111348
Author:
Bruce Crauder, Benny Evans, Alan Noell
Publisher:
Cengage Learning

Holt Mcdougal Larson Pre-algebra: Student Edition…
Algebra
ISBN:
9780547587776
Author:
HOLT MCDOUGAL
Publisher:
HOLT MCDOUGAL

Big Ideas Math A Bridge To Success Algebra 1: Stu…
Algebra
ISBN:
9781680331141
Author:
HOUGHTON MIFFLIN HARCOURT
Publisher:
Houghton Mifflin Harcourt
Functions and Change: A Modeling Approach to Coll…
Algebra
ISBN:
9781337111348
Author:
Bruce Crauder, Benny Evans, Alan Noell
Publisher:
Cengage Learning
Holt Mcdougal Larson Pre-algebra: Student Edition…
Algebra
ISBN:
9780547587776
Author:
HOLT MCDOUGAL
Publisher:
HOLT MCDOUGAL
Big Ideas Math A Bridge To Success Algebra 1: Stu…
Algebra
ISBN:
9781680331141
Author:
HOUGHTON MIFFLIN HARCOURT
Publisher:
Houghton Mifflin Harcourt

Glencoe Algebra 1, Student Edition, 9780079039897…
Algebra
ISBN:
9780079039897
Author:
Carter
Publisher:
McGraw Hill

Algebra & Trigonometry with Analytic Geometry
Algebra
ISBN:
9781133382119
Author:
Swokowski
Publisher:
Cengage