D. 60 percent of all children spend at least how many hours per day unsupervised? hours.
D. 60 percent of all children spend at least how many hours per day unsupervised? hours.

Glencoe Algebra 1, Student Edition, 9780079039897, 0079039898, 2018
18th Edition
ISBN:9780079039897
Author:Carter
Publisher:Carter
Chapter10: Statistics
Section10.4: Distributions Of Data
Problem 19PFA

Related questions
Question
For D only
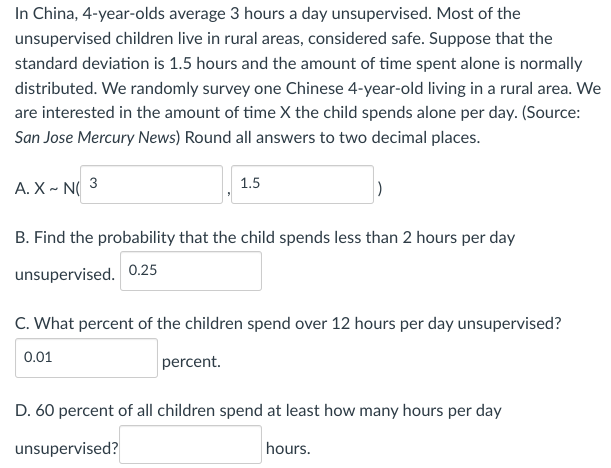
Transcribed Image Text:In China, 4-year-olds average 3 hours a day unsupervised. Most of the
unsupervised children live in rural areas, considered safe. Suppose that the
standard deviation is 1.5 hours and the amount of time spent alone is normally
distributed. We randomly survey one Chinese 4-year-old living in a rural area. We
are interested in the amount of time X the child spends alone per day. (Source:
San Jose Mercury News) Round all answers to two decimal places.
A. X~ N 3
B. Find the probability that the child spends less than 2 hours per day
unsupervised. 0.25
1.5
C. What percent of the children spend over 12 hours per day unsupervised?
0.01
percent.
D. 60 percent of all children spend at least how many hours per day
unsupervised?
hours.
Expert Solution
This question has been solved!
Explore an expertly crafted, step-by-step solution for a thorough understanding of key concepts.

This is a popular solution!

Trending now
This is a popular solution!

Step by step
Solved in 2 steps

Recommended textbooks for you
Glencoe Algebra 1, Student Edition, 9780079039897…
Algebra
ISBN:
9780079039897
Author:
Carter
Publisher:
McGraw Hill
Glencoe Algebra 1, Student Edition, 9780079039897…
Algebra
ISBN:
9780079039897
Author:
Carter
Publisher:
McGraw Hill