d. If aggregate demand in Itera were to increase by $150, draw the new (AD2) curve in the graphing area above. Remember to only the endpoints of the curve. e. The new equilibrium level of GDP is $ and the price index is f. Now there is (Click to select) gap in Itera of $
d. If aggregate demand in Itera were to increase by $150, draw the new (AD2) curve in the graphing area above. Remember to only the endpoints of the curve. e. The new equilibrium level of GDP is $ and the price index is f. Now there is (Click to select) gap in Itera of $

Brief Principles of Macroeconomics (MindTap Course List)
8th Edition
ISBN:9781337091985
Author:N. Gregory Mankiw
Publisher:N. Gregory Mankiw
Chapter5: Measuring A Nation's Income
Section: Chapter Questions
Problem 11PA

Related questions

Question
Please solve d, e, and f
Transcribed Image Text:Since you have posted a question with multiple sub-parts, we will solve first three subparts for you. To get remaining sub-part solved
please repost the complete question and mention the sub-parts to be solved.
Introduction
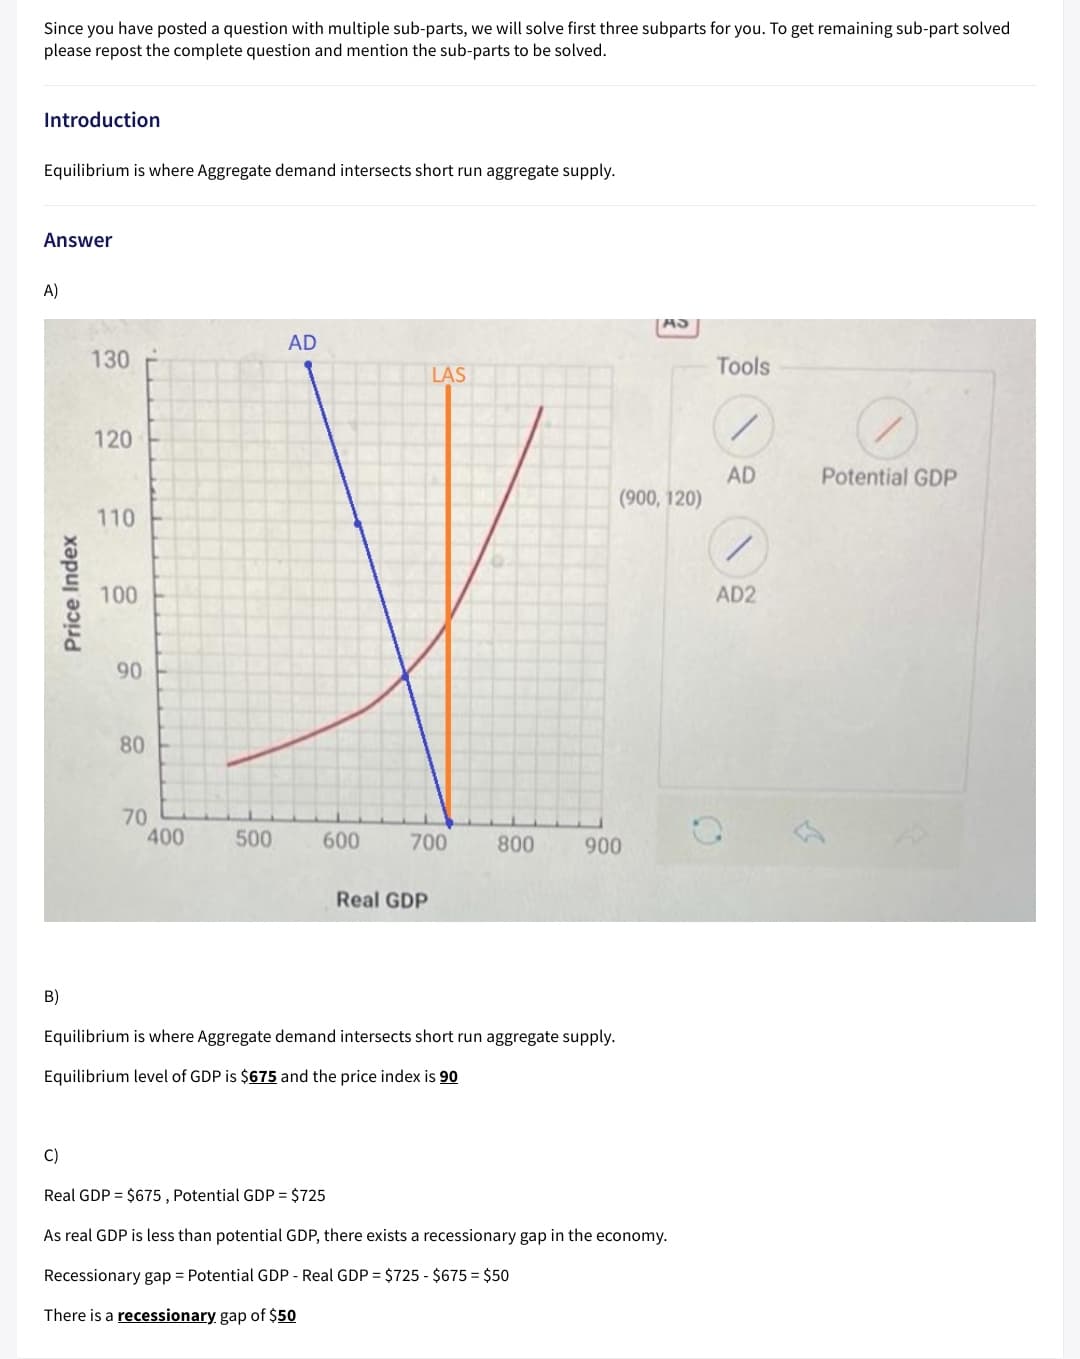
Equilibrium is where Aggregate demand intersects short run aggregate supply.
Answer
A)
AD
130
Tools
LAS
120
AD
(900, 120)
Potential GDP
110
100
AD2
90
80
70
400
500
600
700
800
900
Real GDP
B)
Equilibrium is where Aggregate demand intersects short run aggregate supply.
Equilibrium level of GDP is $675 and the price index is 90
C)
Real GDP = $675 , Potential GDP = $725
As real GDP is less than potential GDP, there exists a recessionary gap in the economy.
Recessionary gap = Potential GDP - Real GDP = $725 - $675 = $50
There is a recessionary gap of $50
Price Index
Transcribed Image Text:please draw graph specify endpoints thanks
1
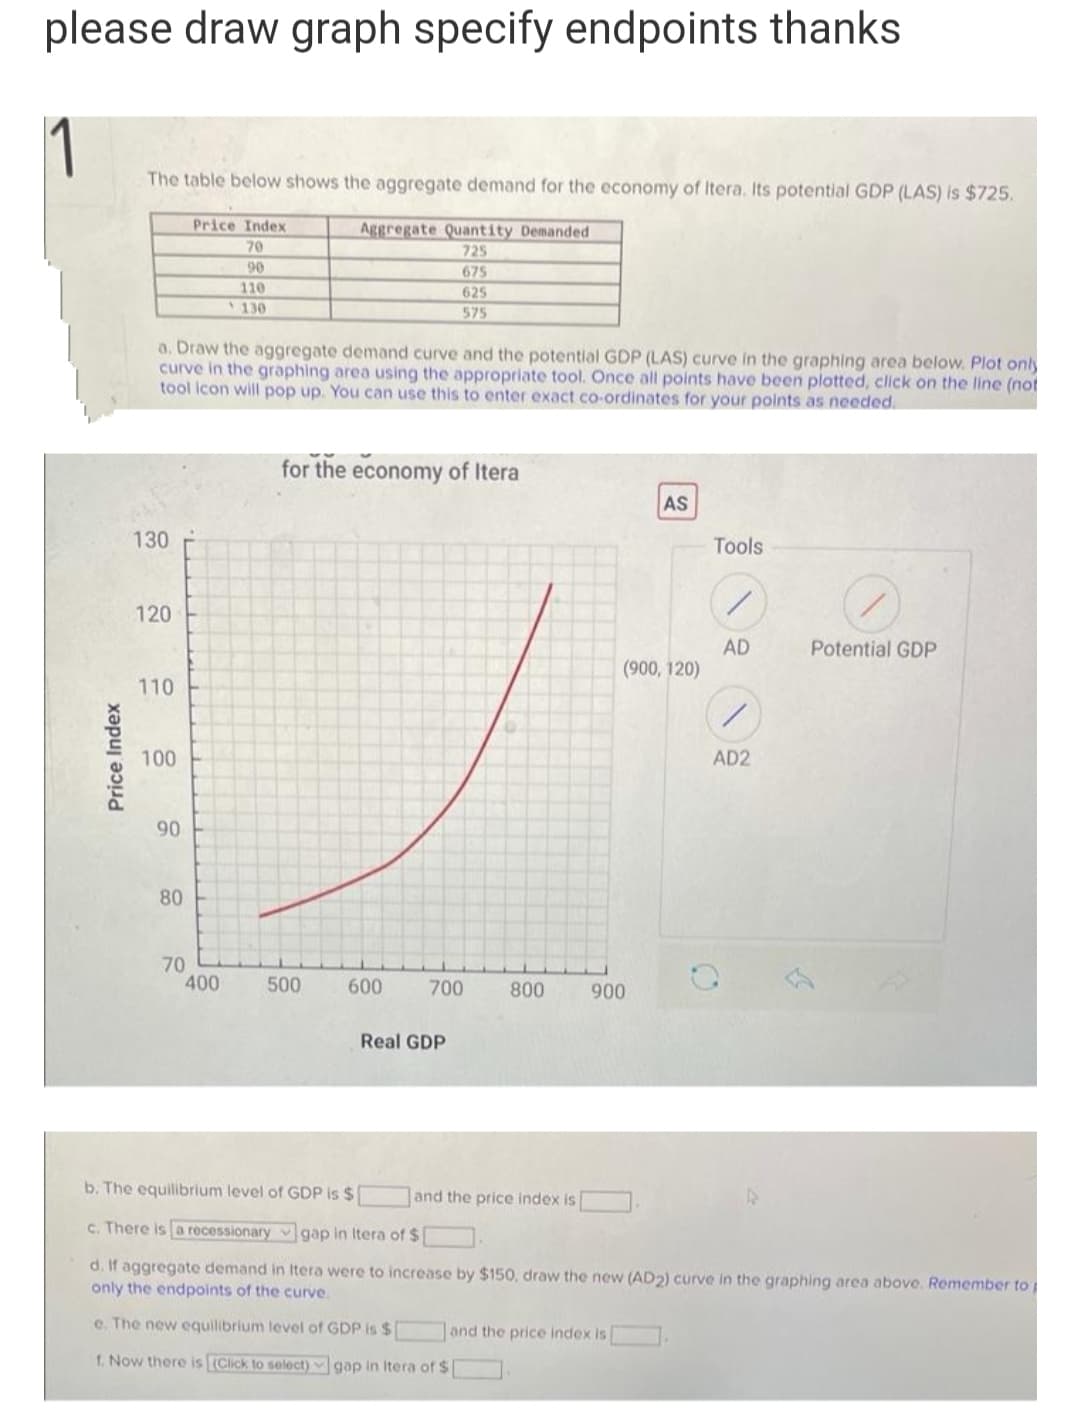
The table below shows the aggregate demand for the economy of Itera. Its potential GDP (LAS) is $725.
Price Index
Aggregate Quantity Demanded
70
725
90
675
110
625
130
575
a. Draw the aggregate demand curve and the potential GDP (LAS) curve in the graphing area below. Plot only
curve in the graphing area using the appropriate tool. Once all points have been plotted, click on the line (not
tool icon will pop up. You can use this to enter exact co-ordinates for your points as needed.
for the economy of Itera
AS
Tools
120
AD
(900, 120)
Potential GDP
110
100
AD2
90
80
70
400
500
600
700
800
900
Real GDP
b. The equilibrium level of GDP is $
and the price index is
c. There is a recessionary v gap in Itera of $
d. If aggregate demand in Itera were to increase by $150, draw the new (AD2) curve in the graphing area above. Remember to
only the endpoints of the curve.
e. The new equilibrium level of GDP is $
and the price index is
f. Now there is (Click to select) gap in Itera of $
Price Index
Expert Solution
This question has been solved!
Explore an expertly crafted, step-by-step solution for a thorough understanding of key concepts.

Step by step
Solved in 2 steps with 1 images

Knowledge Booster


Learn more about
Need a deep-dive on the concept behind this application? Look no further. Learn more about this topic, economics and related others by exploring similar questions and additional content below.Recommended textbooks for you
Brief Principles of Macroeconomics (MindTap Cours…
Economics
ISBN:
9781337091985
Author:
N. Gregory Mankiw
Publisher:
Cengage Learning

Essentials of Economics (MindTap Course List)
Economics
ISBN:
9781337091992
Author:
N. Gregory Mankiw
Publisher:
Cengage Learning

Brief Principles of Macroeconomics (MindTap Cours…
Economics
ISBN:
9781337091985
Author:
N. Gregory Mankiw
Publisher:
Cengage Learning
Essentials of Economics (MindTap Course List)
Economics
ISBN:
9781337091992
Author:
N. Gregory Mankiw
Publisher:
Cengage Learning

Principles of Economics 2e
Economics
ISBN:
9781947172364
Author:
Steven A. Greenlaw; David Shapiro
Publisher:
OpenStax

