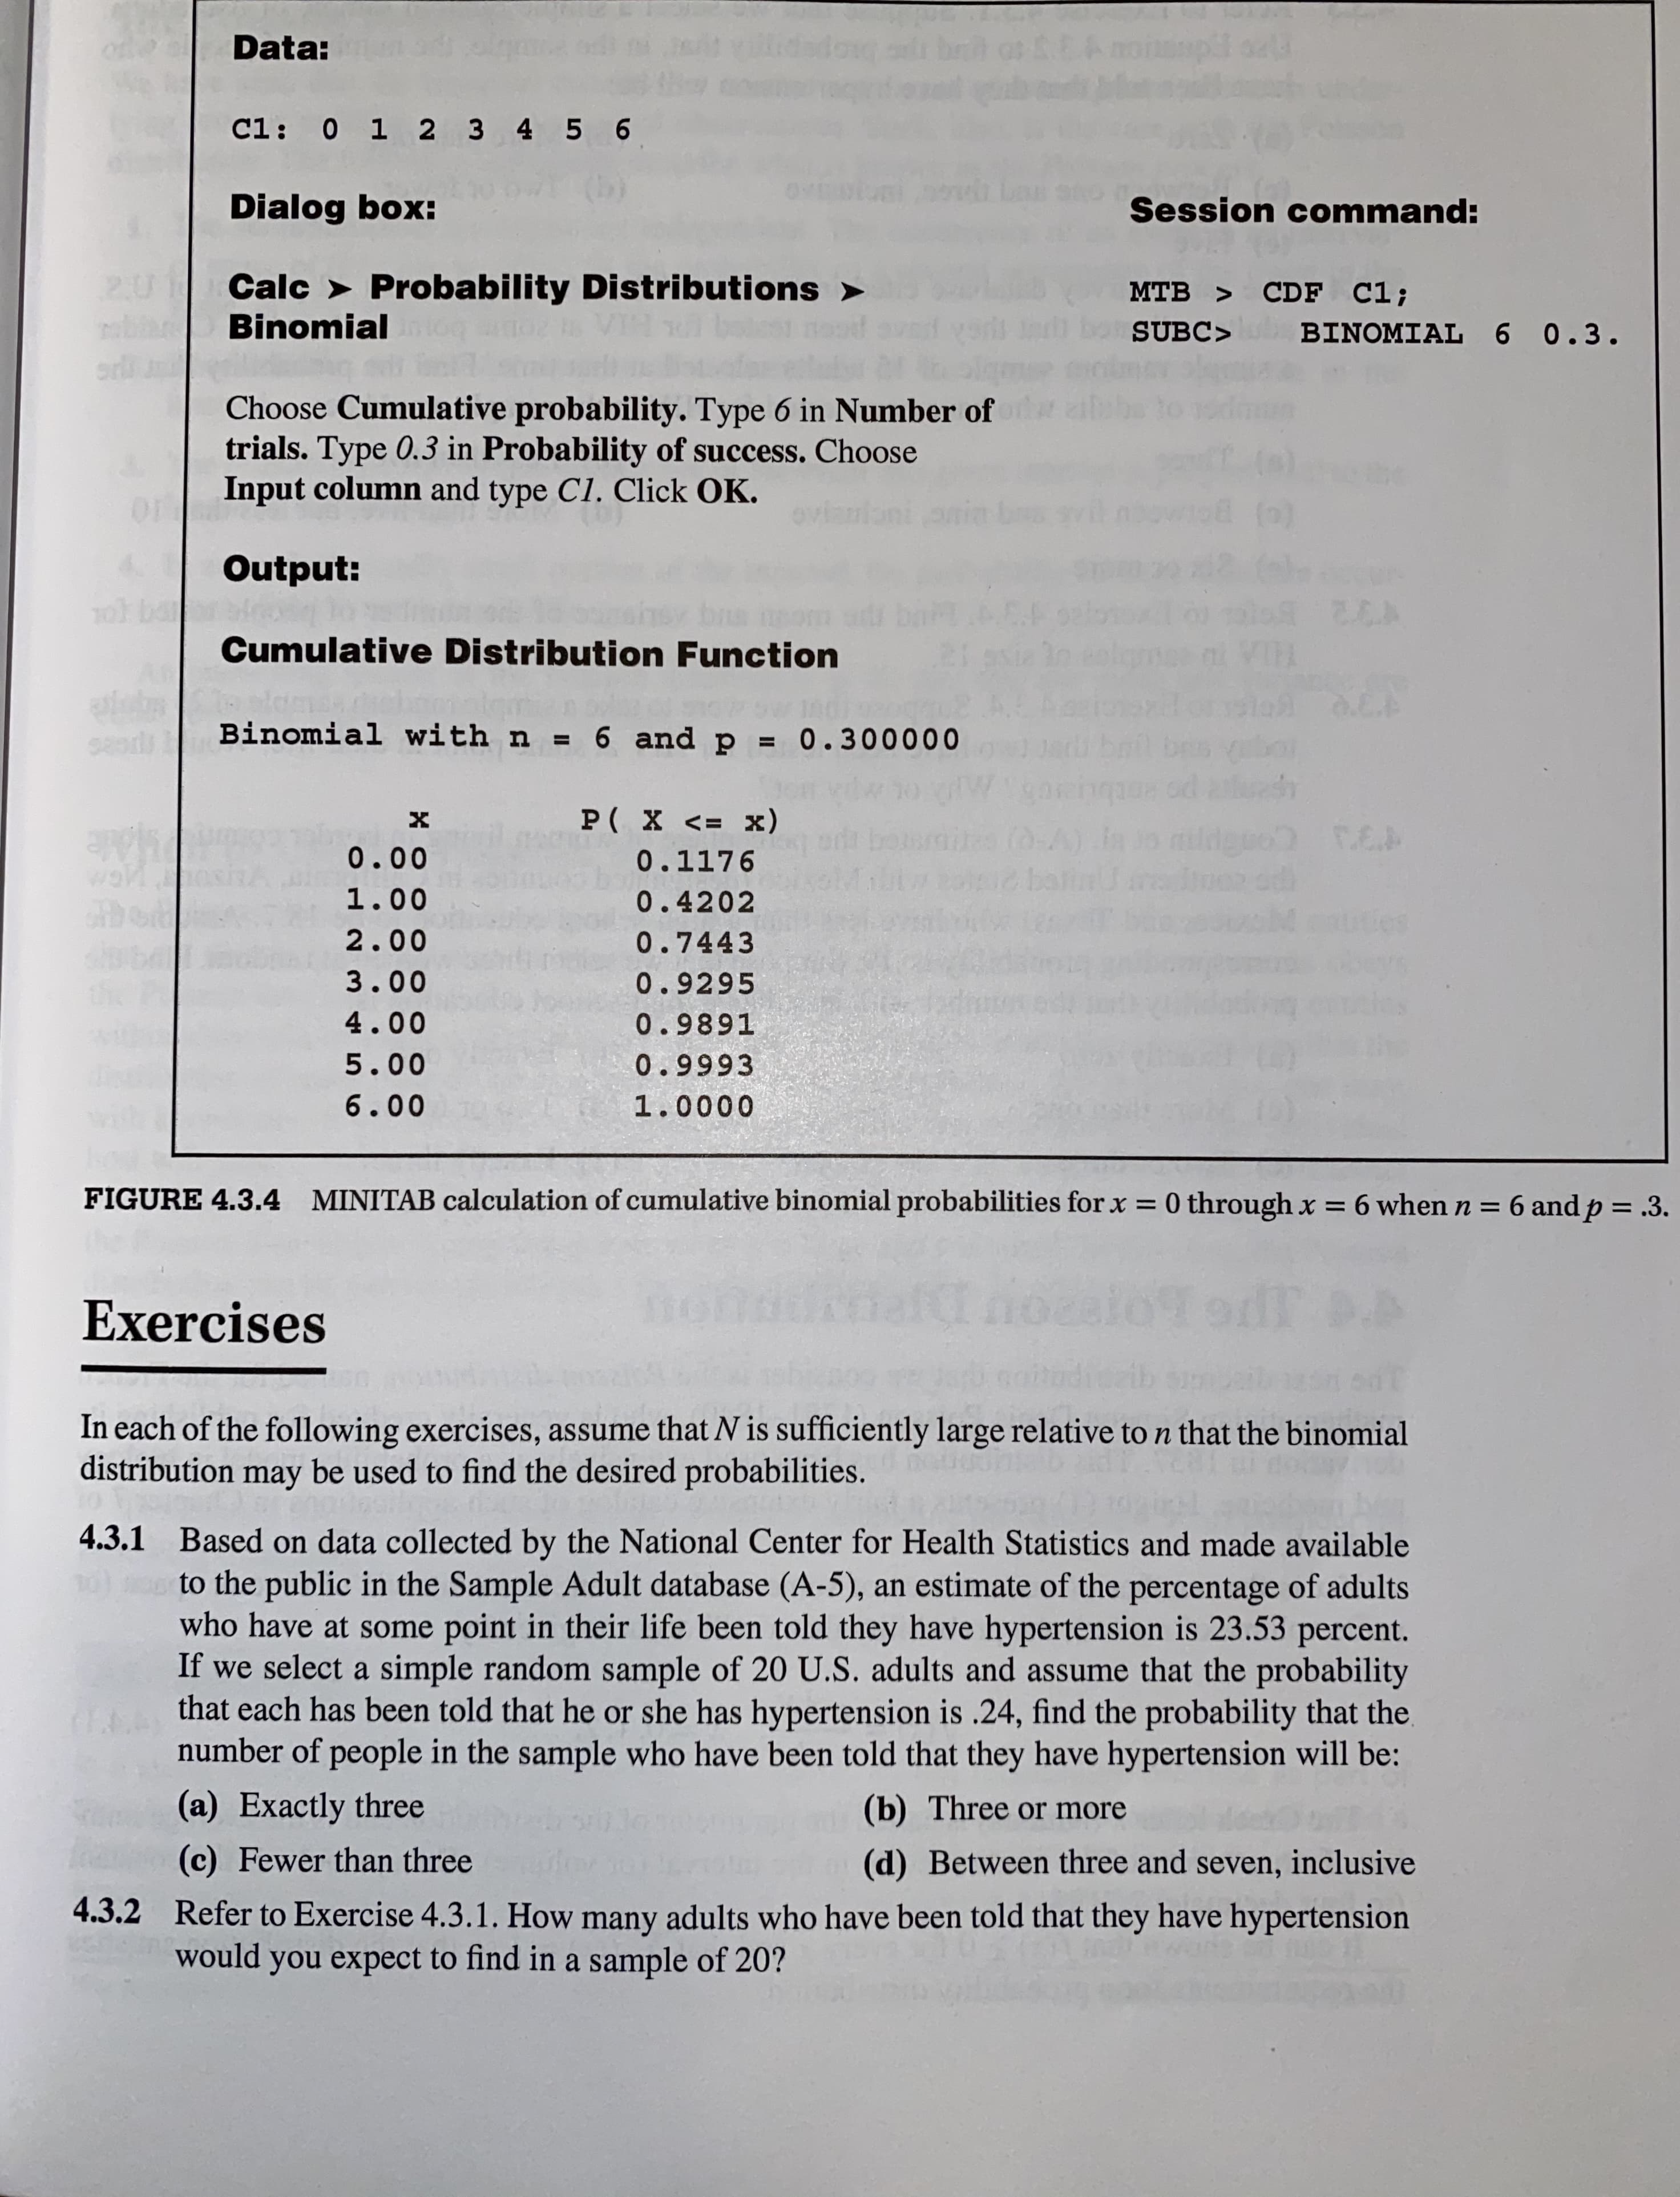
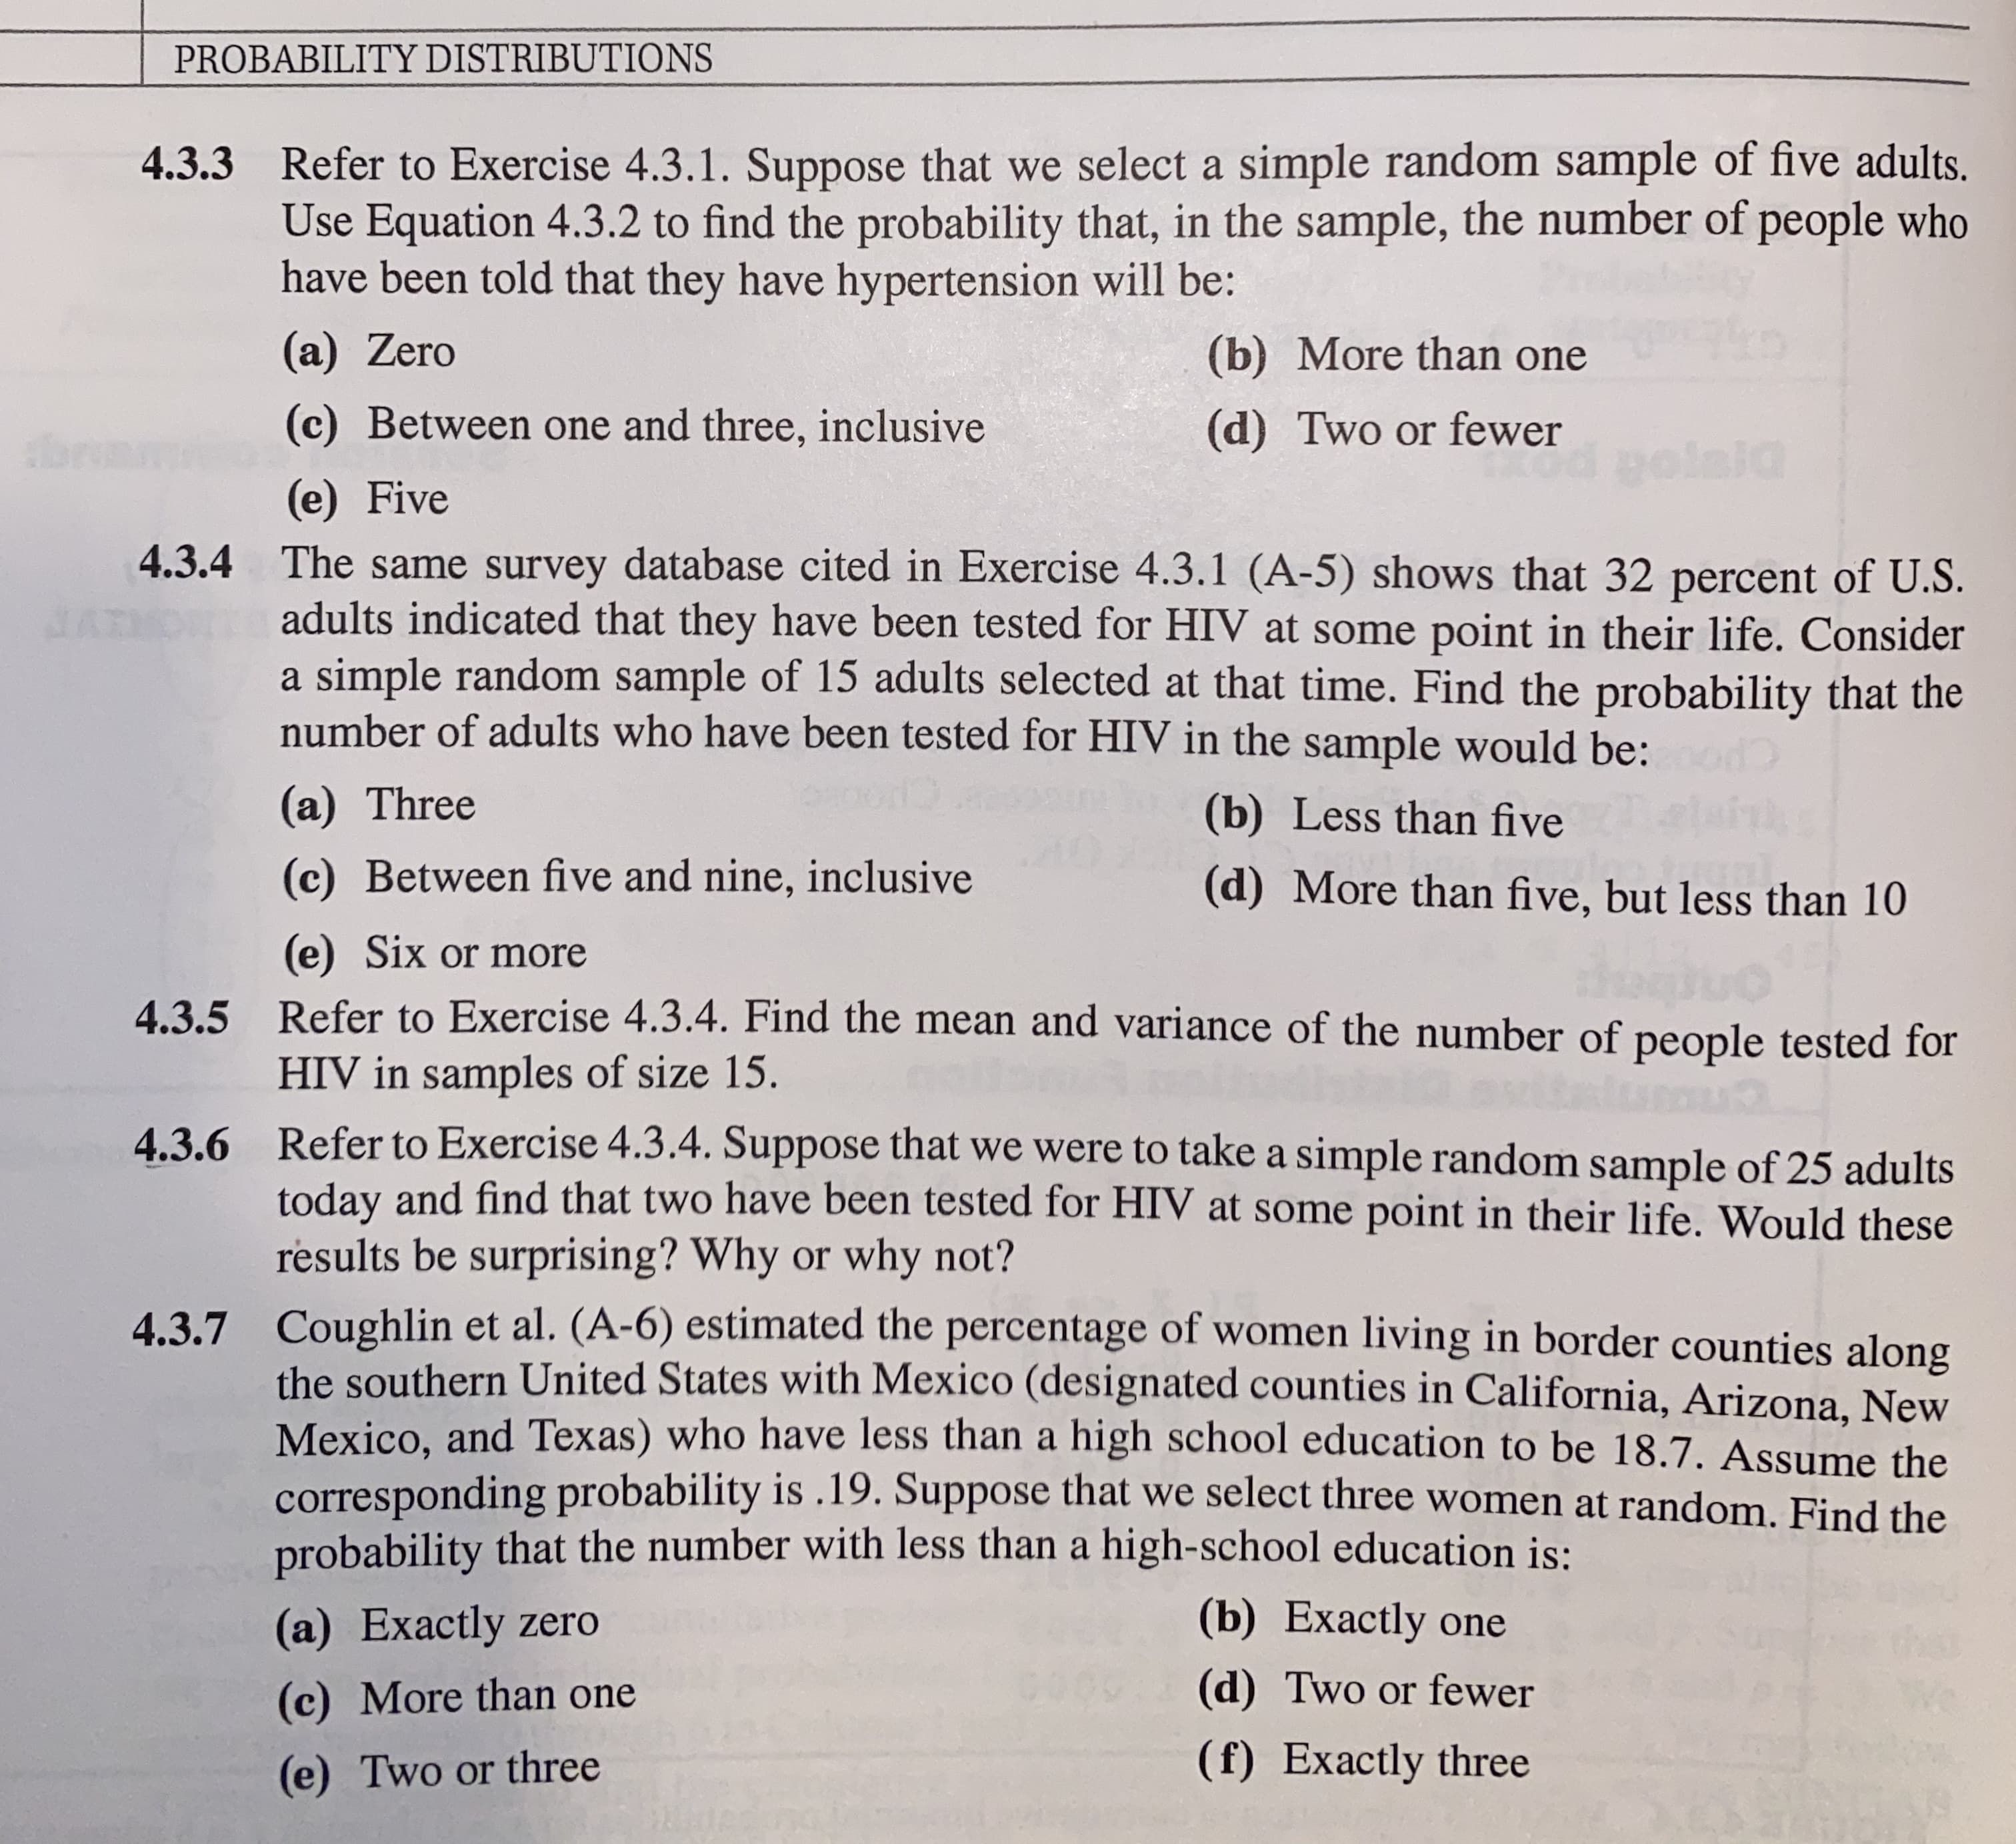
Data: Cl: 0 1 2 3 4 5 6 Dialog box: Session command: 20 Calc > Probability Distributions > Binomial MTB > CDF C1; SUBC> BINOMIAL 6 0.3. Choose Cumulative probability. Type 6 in Number of trials. Type 0.3 in Probability of success. Choose Input column and type Cl. Click OK. (o) Output: o ba ECA Cumulative Distribution Function VIH sead Binomial with n = 6 and p = 0.300000 %3D P( X <= x) (0-A).in io mildepo EA 0.00 0.1176 1.00 0.4202 2.00 0.7443 3.00 0.9295 4.00 0.9891 5.00 0.9993 6.00 1.0000 FIGURE 4.3.4 MINITAB calculation of cumulative binomial probabilities for x = 0 through x = 6 when n = 6 and p = .3. %3D %3D Exercises In In each of the following exercises, assume that N is sufficiently large relative to n that the binomial distribution may be used to find the desired probabilities. 4.3.1 Based on data collected by the National Center for Health Statistics and made available to the public in the Sample Adult database (A-5), an estimate of the percentage of adults who have at some point in their life been told they have hypertension is 23.53 percent. If we select a simple random sample of 20 U.S. adults and assume that the probability that each has been told that he or she has hypertension is .24, find the probability that the number of people in the sample who have been told that they have hypertension will be: (a) Exactly three (b) Three or more (c) Fewer than three (d) Between three and seven, inclusive 4.3.2 Refer to Exercise 4.3.1. How many adults who have been told that they have hypertension would you expect to find in a sample of 20? PROBABILITY DISTRIBUTIONS 4.3.3 Refer to Exercise 4.3.1. Suppose that we select a simple random sample of five adults. Use Equation 4.3.2 to find the probability that, in the sample, the number of people who have been told that they have hypertension will be: (a) Zero (b) More than one (c) Between one and three, inclusive (d) Two or fewer tbr d polaia (e) Five 4.3.4 The same survey database cited in Exercise 4.3.1 (A-5) shows that 32 percent of U.S. adults indicated that they have been tested for HIV at some point in their life. Consider a simple random sample of 15 adults selected at that time. Find the probability that the number of adults who have been tested for HIV in the sample would be: (a) Three (b) Less than five (c) Between five and nine, inclusive (d) More than five, but less than 10 (e) Six or more 4.3.5 Refer to Exercise 4.3.4. Find the mean and variance of the number of people tested for HIV in samples of size 15. 4.3.6 Refer to Exercise 4.3.4. Suppose that we were to take a simple random sample of 25 adults today and find that two have been tested for HIV at some point in their life. Would these results be surprising? Why or why not? 4.3.7 Coughlin et al. (A-6) estimated the percentage of women living in border counties along the southern United States with Mexico (designated counties in California, Arizona, New Mexico, and Texas) who have less than a high school education to be 18.7. Assume the corresponding probability is .19. Suppose that we select three women at random. Find the probability that the number with less than a high-school education is: (a) Exactly zero (b) Exactly one (c) More than one (d) Two or fewer (e) Two or three (f) Exactly three


Contingency Table
A contingency table can be defined as the visual representation of the relationship between two or more categorical variables that can be evaluated and registered. It is a categorical version of the scatterplot, which is used to investigate the linear relationship between two variables. A contingency table is indeed a type of frequency distribution table that displays two variables at the same time.
Binomial Distribution
Binomial is an algebraic expression of the sum or the difference of two terms. Before knowing about binomial distribution, we must know about the binomial theorem.
can you help with 4.3.3 please. information thats needed for it will be in both pictures submitted


Trending now
This is a popular solution!

Step by step
Solved in 5 steps with 5 images


