Data Management - Statisitcal Analysis Describe each graph seperately. Explain the type of graph with description of variables as well as any visual trend/relation in data.
Data Management - Statisitcal Analysis Describe each graph seperately. Explain the type of graph with description of variables as well as any visual trend/relation in data.

MATLAB: An Introduction with Applications
6th Edition
ISBN:9781119256830
Author:Amos Gilat
Publisher:Amos Gilat
Chapter1: Starting With Matlab
Section: Chapter Questions
Problem 1P

Related questions
Question
Data Management - Statisitcal Analysis
Describe each graph seperately. Explain the type of graph with description of variables as well as any visual trend/relation in data.
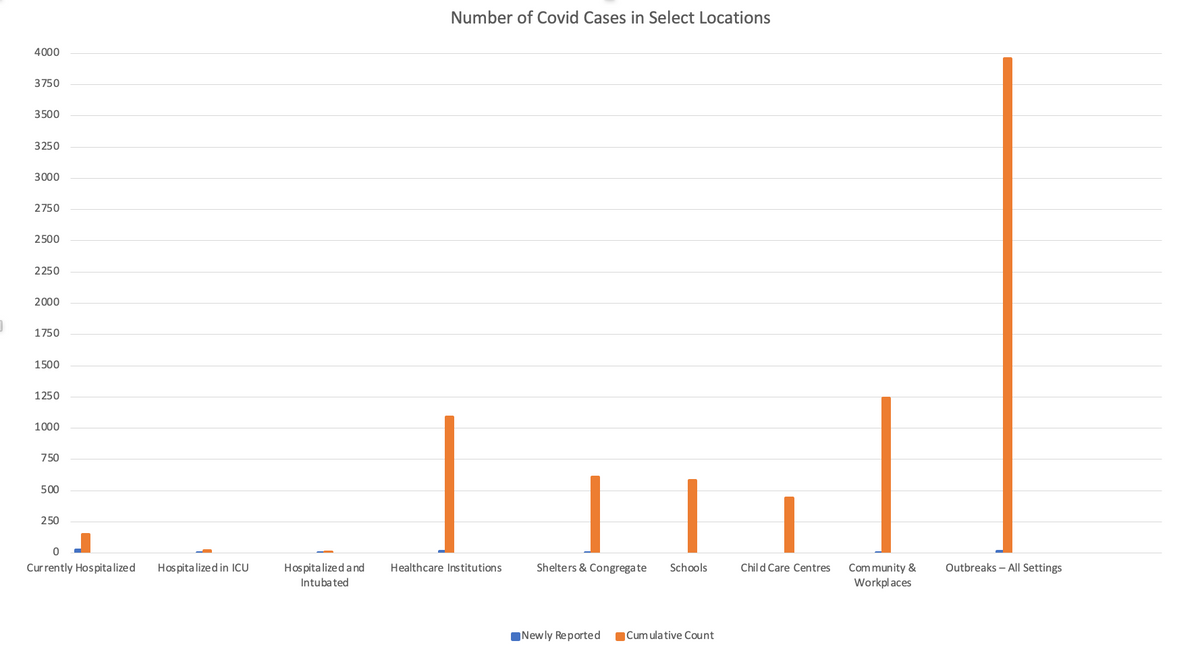
Transcribed Image Text:4000
3750
3500
3250
3000
2750
2500
2250
2000
1750
1500
1250
1000
750
500
250
0
Currently Hospitalized
Hospitalized in ICU
Hospitalized and
Intubated
Number of Covid Cases in Select Locations
Shelters & Congregate
Schools
Cumulative Count
Healthcare Institutions
Newly Reported
Child Care Centres
Community &
Workplaces
Outbreaks - All Settings
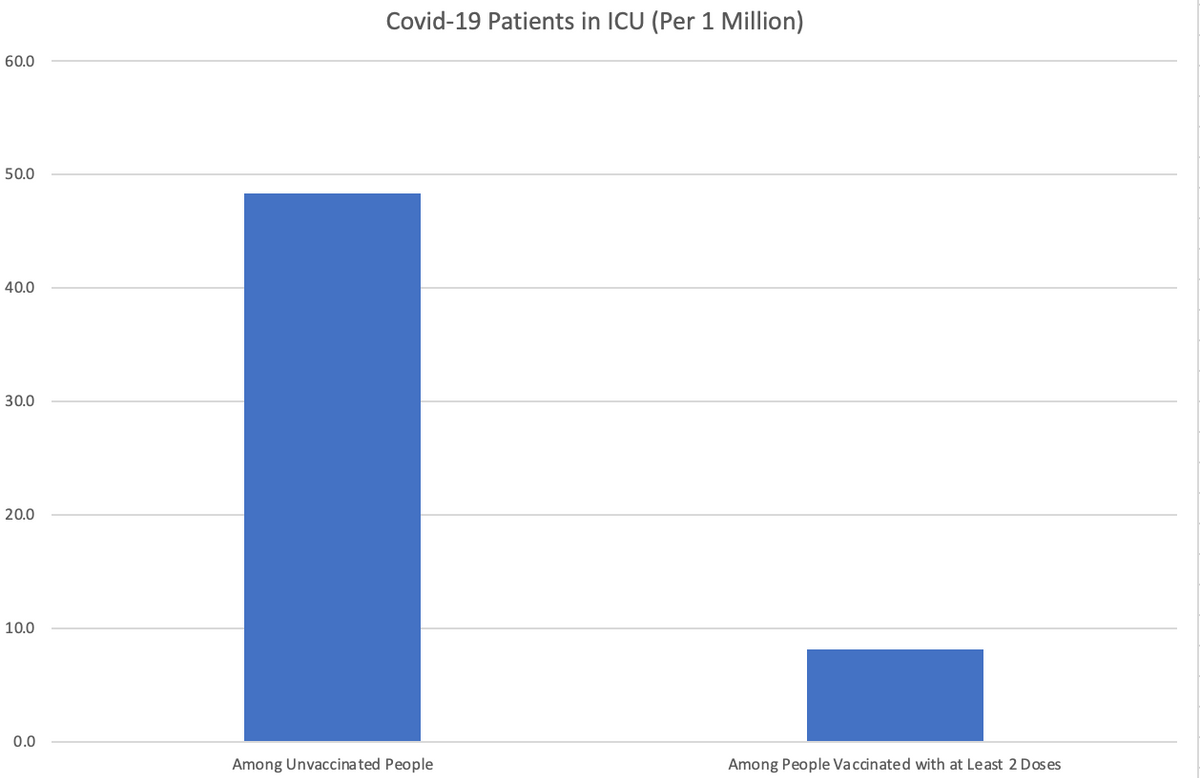
Transcribed Image Text:60.0
50.0
40.0
30.0
20.0
10.0
0.0
Covid-19 Patients in ICU (Per 1 Million)
Among Unvaccinated People
Among People Vaccinated with at Least 2 Dos es
Expert Solution
This question has been solved!
Explore an expertly crafted, step-by-step solution for a thorough understanding of key concepts.

Step by step
Solved in 2 steps

Recommended textbooks for you
MATLAB: An Introduction with Applications
Statistics
ISBN:
9781119256830
Author:
Amos Gilat
Publisher:
John Wiley & Sons Inc

Probability and Statistics for Engineering and th…
Statistics
ISBN:
9781305251809
Author:
Jay L. Devore
Publisher:
Cengage Learning

Statistics for The Behavioral Sciences (MindTap C…
Statistics
ISBN:
9781305504912
Author:
Frederick J Gravetter, Larry B. Wallnau
Publisher:
Cengage Learning
MATLAB: An Introduction with Applications
Statistics
ISBN:
9781119256830
Author:
Amos Gilat
Publisher:
John Wiley & Sons Inc
Probability and Statistics for Engineering and th…
Statistics
ISBN:
9781305251809
Author:
Jay L. Devore
Publisher:
Cengage Learning
Statistics for The Behavioral Sciences (MindTap C…
Statistics
ISBN:
9781305504912
Author:
Frederick J Gravetter, Larry B. Wallnau
Publisher:
Cengage Learning

Elementary Statistics: Picturing the World (7th E…
Statistics
ISBN:
9780134683416
Author:
Ron Larson, Betsy Farber
Publisher:
PEARSON

The Basic Practice of Statistics
Statistics
ISBN:
9781319042578
Author:
David S. Moore, William I. Notz, Michael A. Fligner
Publisher:
W. H. Freeman

Introduction to the Practice of Statistics
Statistics
ISBN:
9781319013387
Author:
David S. Moore, George P. McCabe, Bruce A. Craig
Publisher:
W. H. Freeman