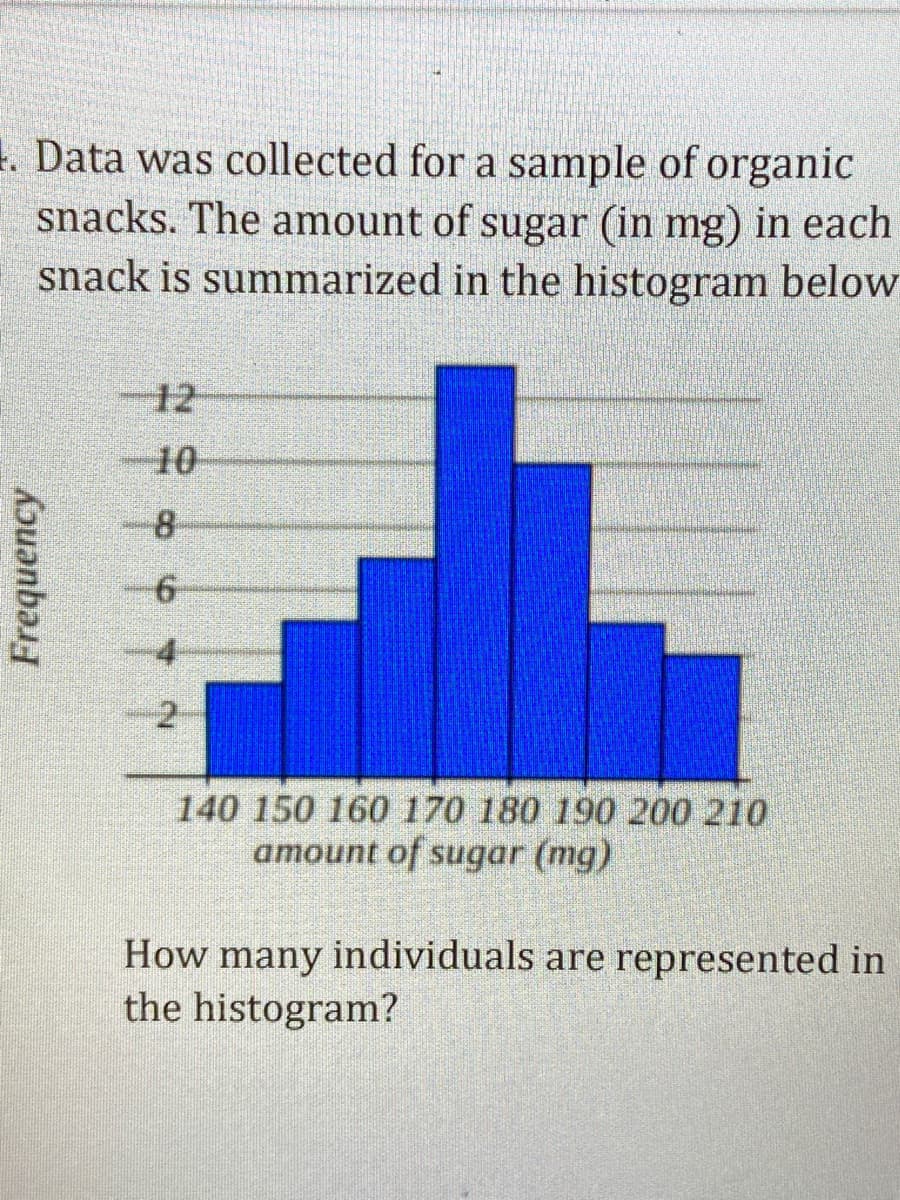
Data was collected for a sample of organic snacks. The amount of sugar (in mg) in each snack is summarized in the histogram below 12 10 8. 140 150 160 170 180 190 200 210 amount of sugar (mg) How many individuals are represented in the histogram?
Data was collected for a sample of organic snacks. The amount of sugar (in mg) in each snack is summarized in the histogram below 12 10 8. 140 150 160 170 180 190 200 210 amount of sugar (mg) How many individuals are represented in the histogram?

Big Ideas Math A Bridge To Success Algebra 1: Student Edition 2015
1st Edition
ISBN:9781680331141
Author:HOUGHTON MIFFLIN HARCOURT
Publisher:HOUGHTON MIFFLIN HARCOURT
Chapter11: Data Analysis And Displays
Section: Chapter Questions
Problem 8CR

Related questions

Topic Video
Question
Transcribed Image Text:1. Data was collected for a sample of organic
snacks. The amount of sugar (in mg) in each
snack is summarized in the histogram below
12
10
2.
140 150 160 170 180 190 200 210
amount of sugar (mg)
How many individuals are represented in
the histogram?
Frequency
Expert Solution
This question has been solved!
Explore an expertly crafted, step-by-step solution for a thorough understanding of key concepts.

This is a popular solution!

Trending now
This is a popular solution!

Step by step
Solved in 2 steps with 2 images

Knowledge Booster


Learn more about
Need a deep-dive on the concept behind this application? Look no further. Learn more about this topic, statistics and related others by exploring similar questions and additional content below.Recommended textbooks for you
Big Ideas Math A Bridge To Success Algebra 1: Stu…
Algebra
ISBN:
9781680331141
Author:
HOUGHTON MIFFLIN HARCOURT
Publisher:
Houghton Mifflin Harcourt
Big Ideas Math A Bridge To Success Algebra 1: Stu…
Algebra
ISBN:
9781680331141
Author:
HOUGHTON MIFFLIN HARCOURT
Publisher:
Houghton Mifflin Harcourt