Define the null and alternative hypotheses of the x test for the above output. Find the missing values *', **', ***', Showing necessary working What is the degree of freedom for this test? Estimate the p-value for this test. State the conclusion for the test. Give reason for your answer.
Define the null and alternative hypotheses of the x test for the above output. Find the missing values *', **', ***', Showing necessary working What is the degree of freedom for this test? Estimate the p-value for this test. State the conclusion for the test. Give reason for your answer.

MATLAB: An Introduction with Applications
6th Edition
ISBN:9781119256830
Author:Amos Gilat
Publisher:Amos Gilat
Chapter1: Starting With Matlab
Section: Chapter Questions
Problem 1P

Related questions
Topic Video
Question
Please answer the attached questions
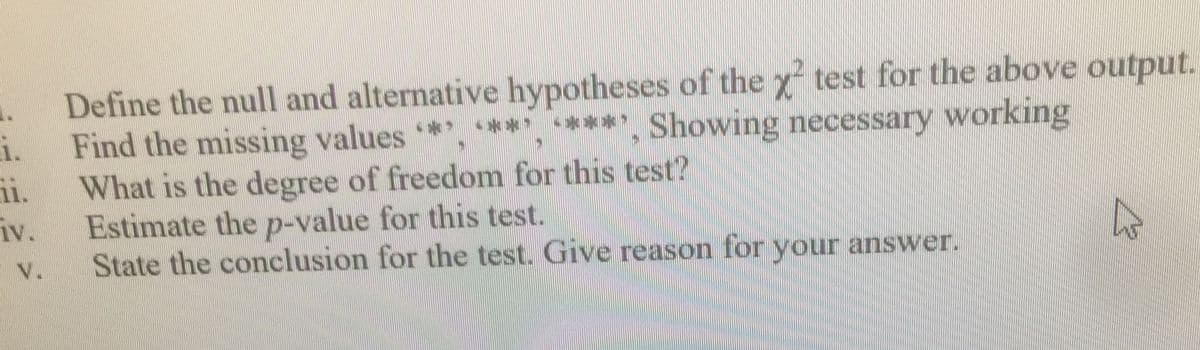
Transcribed Image Text:Define the null and alternative hypotheses of the x test for the above output.
i.
Find the missing values *, ****, ****, Showing necessary working
i.
What is the degree of freedom för this test?
iv.
Estimate the p-value for this test.
V.
State the conclusion for the test. Give reason for your answer.
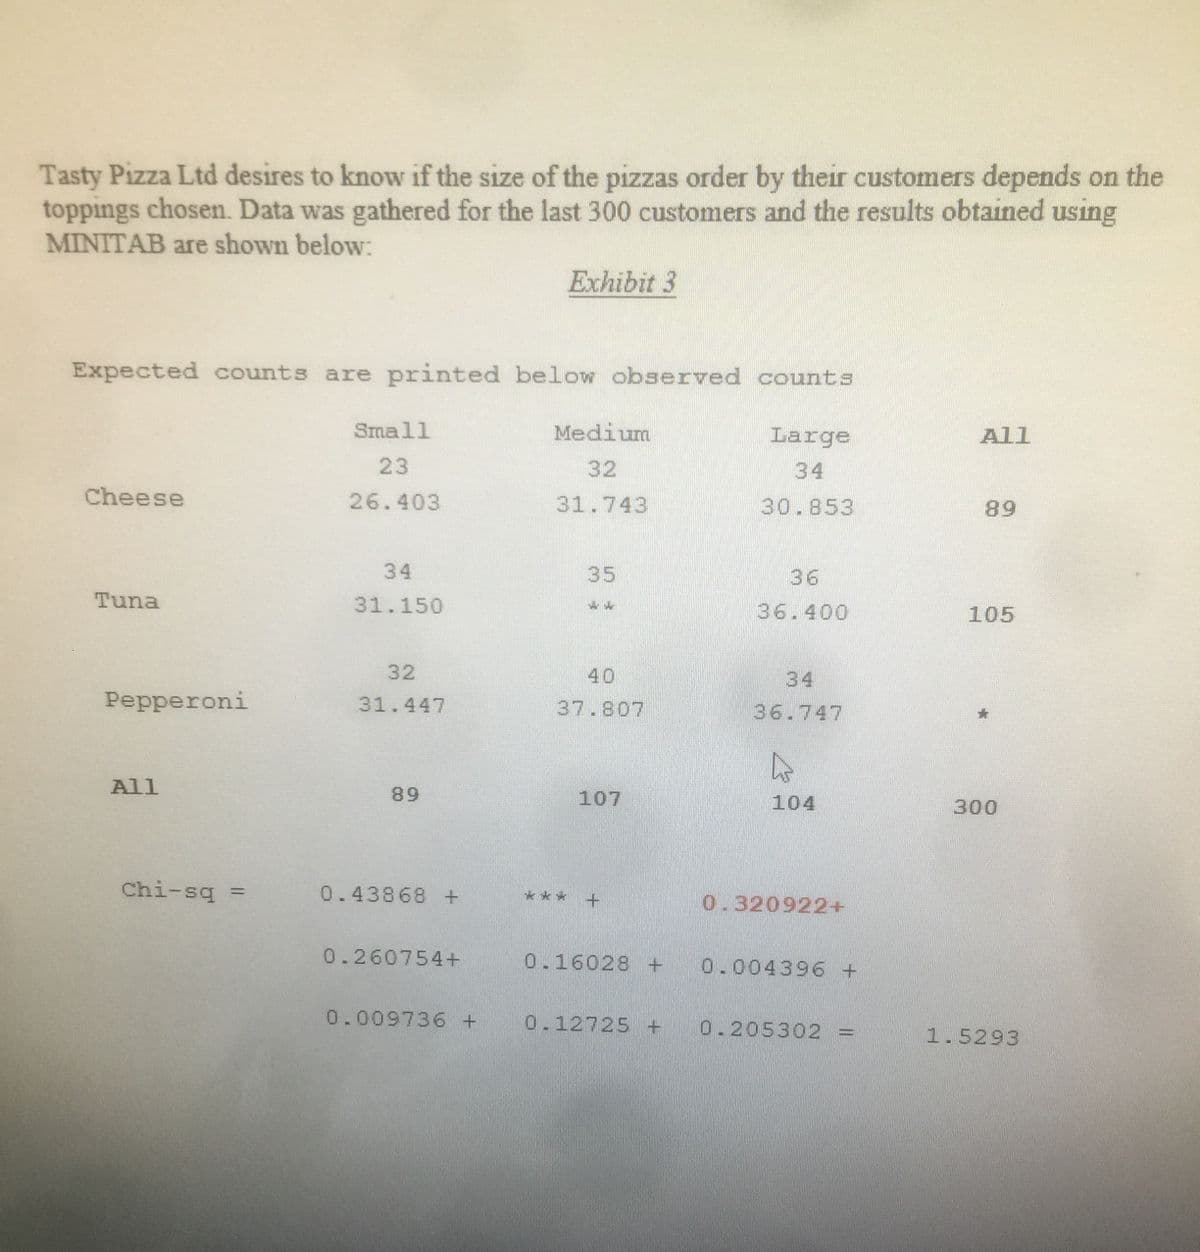
Transcribed Image Text:Tasty Pizza Ltd desires to know if the size of the pizzas order by their customers depends on the
toppings chosen. Data was gathered for the last 300 customers and the results obtained using
MINITAB are shown below:
Exhibit 3
Expected counts are printed below observed counts
Small
Medium
Large
All
23
32
34
Cheese
26.403
31.743
30.853
89
34
35
36
Tuna
31.150
36.400
105
32
40
34
Pepperoni
31.447
37.807
36.747
All
89
107
104
300
Chi-sq =
0.43868 +
***
0.320922+
0.260754+
0.16028 +
0.004396 +
0.009736 + 0.12725 + 0.205302 =
1.5293
Expert Solution
This question has been solved!
Explore an expertly crafted, step-by-step solution for a thorough understanding of key concepts.

This is a popular solution!

Trending now
This is a popular solution!

Step by step
Solved in 3 steps with 1 images

Knowledge Booster


Learn more about
Need a deep-dive on the concept behind this application? Look no further. Learn more about this topic, statistics and related others by exploring similar questions and additional content below.Recommended textbooks for you
MATLAB: An Introduction with Applications
Statistics
ISBN:
9781119256830
Author:
Amos Gilat
Publisher:
John Wiley & Sons Inc

Probability and Statistics for Engineering and th…
Statistics
ISBN:
9781305251809
Author:
Jay L. Devore
Publisher:
Cengage Learning

Statistics for The Behavioral Sciences (MindTap C…
Statistics
ISBN:
9781305504912
Author:
Frederick J Gravetter, Larry B. Wallnau
Publisher:
Cengage Learning
MATLAB: An Introduction with Applications
Statistics
ISBN:
9781119256830
Author:
Amos Gilat
Publisher:
John Wiley & Sons Inc
Probability and Statistics for Engineering and th…
Statistics
ISBN:
9781305251809
Author:
Jay L. Devore
Publisher:
Cengage Learning
Statistics for The Behavioral Sciences (MindTap C…
Statistics
ISBN:
9781305504912
Author:
Frederick J Gravetter, Larry B. Wallnau
Publisher:
Cengage Learning

Elementary Statistics: Picturing the World (7th E…
Statistics
ISBN:
9780134683416
Author:
Ron Larson, Betsy Farber
Publisher:
PEARSON

The Basic Practice of Statistics
Statistics
ISBN:
9781319042578
Author:
David S. Moore, William I. Notz, Michael A. Fligner
Publisher:
W. H. Freeman

Introduction to the Practice of Statistics
Statistics
ISBN:
9781319013387
Author:
David S. Moore, George P. McCabe, Bruce A. Craig
Publisher:
W. H. Freeman