Suppose you are testing Ho =.45 versus Ha > .45 random sample of 310 people produces a value of p= .465. Use= .05 to test this hypothesis. %3D Instruot
Suppose you are testing Ho =.45 versus Ha > .45 random sample of 310 people produces a value of p= .465. Use= .05 to test this hypothesis. %3D Instruot

College Algebra (MindTap Course List)
12th Edition
ISBN:9781305652231
Author:R. David Gustafson, Jeff Hughes
Publisher:R. David Gustafson, Jeff Hughes
Chapter8: Sequences, Series, And Probability
Section8.7: Probability
Problem 6E: List the sample space of each experiment. Tossing three coins

Related questions
Question
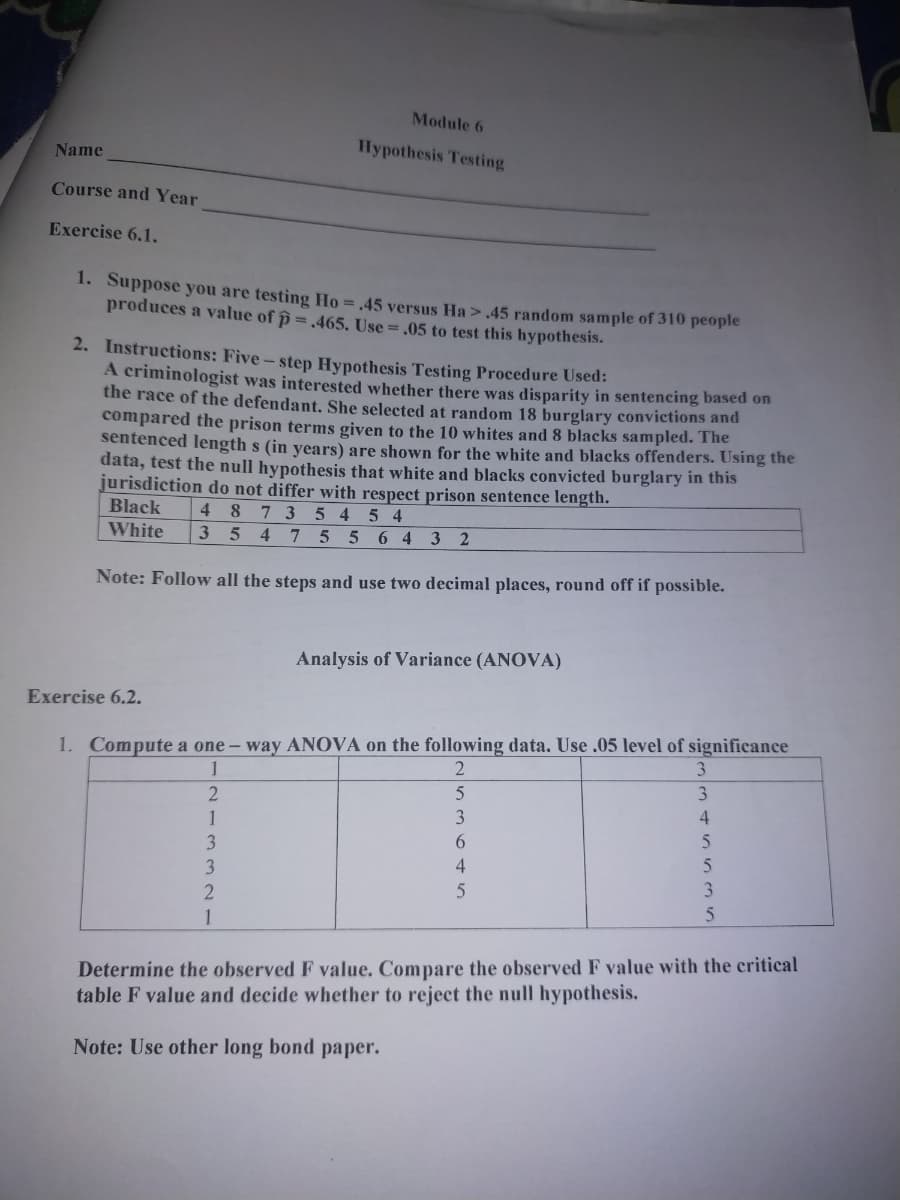
Transcribed Image Text:Module 6
Hypothesis Testing
Name
Course and Year
Exercise 6.1,
1. Suppose you are testing Ho = .45 versus Ha >.45 random sample of 310 people
produces a value of p = .465. Use= .05 to test this hypothesis.
2. Instructions: Five - step Hypothesis Testing Procedure Used:
A criminologist was interested whether there was disparity in sentencing based on
the race of the defendant. She selected at random 18 burglary convictions and
compared the prison terms given to the 10 whites and 8 blacks sampled. The
sentenced length s (in years) are shown for the white and blacks offenders. Using the
data, test the null hypothesis that white and blacks convicted burglary in this
jurisdiction do not differ with respect prison sentence length.
Black
8735 4
3547 5 5 6 4 3 2
4
54
White
Note: Follow all the steps and use two decimal places, round off if possible.
Analysis of Variance (ANOVA)
Exercise 6.2.
1. Compute a one - way ANOVA on the following data. Use .05 level of significance
3
1
3
3
4
1
3.
6.
3
5
1
Determine the observed F value. Compare the observed F value with the critical
table F value and decide whether to reject the null hypothesis.
Note: Use other long bond paper.
Expert Solution
This question has been solved!
Explore an expertly crafted, step-by-step solution for a thorough understanding of key concepts.

This is a popular solution!

Trending now
This is a popular solution!

Step by step
Solved in 2 steps

Recommended textbooks for you
College Algebra (MindTap Course List)
Algebra
ISBN:
9781305652231
Author:
R. David Gustafson, Jeff Hughes
Publisher:
Cengage Learning

Holt Mcdougal Larson Pre-algebra: Student Edition…
Algebra
ISBN:
9780547587776
Author:
HOLT MCDOUGAL
Publisher:
HOLT MCDOUGAL

College Algebra (MindTap Course List)
Algebra
ISBN:
9781305652231
Author:
R. David Gustafson, Jeff Hughes
Publisher:
Cengage Learning
Holt Mcdougal Larson Pre-algebra: Student Edition…
Algebra
ISBN:
9780547587776
Author:
HOLT MCDOUGAL
Publisher:
HOLT MCDOUGAL