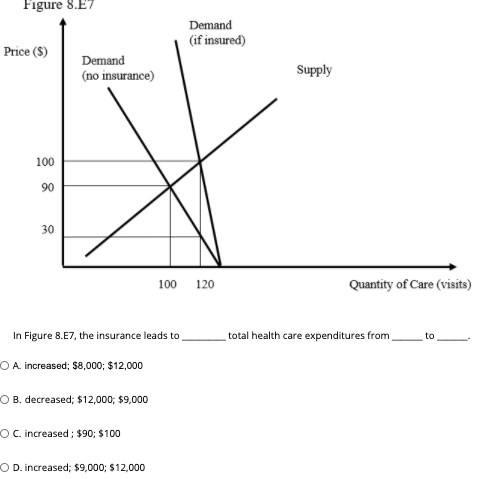
Demand (if insured) Price ($) Demand Supply (no insurance) 100 90 30 100 120 Quantity of Care (visits) In Figure 8.E7, the insurance leads to _ total health care expenditures from to DA increased; $8,000; $12,000 O B. decreased; $12,000; $9,000 O C increased; $90; $100 D D. increased; $9,000; $12,000
Demand (if insured) Price ($) Demand Supply (no insurance) 100 90 30 100 120 Quantity of Care (visits) In Figure 8.E7, the insurance leads to _ total health care expenditures from to DA increased; $8,000; $12,000 O B. decreased; $12,000; $9,000 O C increased; $90; $100 D D. increased; $9,000; $12,000

Chapter14: Medical Care Systems Worldwide
Section: Chapter Questions
Problem 1QAP

Related questions
Question
Transcribed Image Text:Figure 8.E7
Demand
(if insured)
Price (S)
Demand
Supply
(no insurance)
100
90
30
100 120
Quantity of Care (visits)
In Figure 8.E7, the insurance leads to
total health care expenditures from,
to
OA. increased; $8,000; $12,000
O B. decreased; $12,000; $9,000
OC. increased; $90; $100
O D. increased; $9,000; $12,000
Expert Solution
Step 1
Here looking the graph, it can be seen the equilibrium without the insurance is at the intersection of the demand and supply curve at equilibrium quantity of care as 100 with price as $90.
With being insured, the equilibrium shifted from the previous point because of the shift in the demand curve which changes the equilibrium point of the quantity of care as 120 and price being $100
Step 2
It can be seen that because of the insurance, the total health care expenditures have been increased from $9000 of the initial equilibrium as to $12000 of the new equilibrium as .

Step by step
Solved in 3 steps

Knowledge Booster


Learn more about
Need a deep-dive on the concept behind this application? Look no further. Learn more about this topic, economics and related others by exploring similar questions and additional content below.Recommended textbooks for you

Principles of Economics 2e
Economics
ISBN:
9781947172364
Author:
Steven A. Greenlaw; David Shapiro
Publisher:
OpenStax
Principles of Economics 2e
Economics
ISBN:
9781947172364
Author:
Steven A. Greenlaw; David Shapiro
Publisher:
OpenStax